I Can Think Like a Geographer!
Patterns and Trends
MINDS ON
There has been no more influential technology in studying spatial (definition:relating to locations or regions on the earth's surface) and temporal (definition:relating to observations over time) changes to the Earth’s surface than that of Remote Sensing satellites. These “eyes in the sky” continuously scan the Earth’s surface, observing and recording the smallest changes.
 Did You Know?
Geographers interpret the images produced by satellites, alter their properties to amplify or reveal patterns, and eventually use this data to better understand how the Earth is changing for better or worse.
Using our powerful pattern recognition abilities, we will study a series of before and after satellite images of both human events and natural hazards affecting our planet.
When viewing these images, use the concept of spatial significance and the questioning tools you learned in Activity 1 to understand the study area. Once you are confident that you know what you’re looking at, attempt to identify:
- How the landscape has changed spatially and temporally.
- Why that location is changing/what caused the change.
Keep a record of what you observe in a way that you see fit.
MindsOn
ACTION
Part 1:
While interpreting the satellite images in the Minds On, you compared one image to the next, making sense of observable changes. When you looked through each, how did you organize the information you found?
Reflection
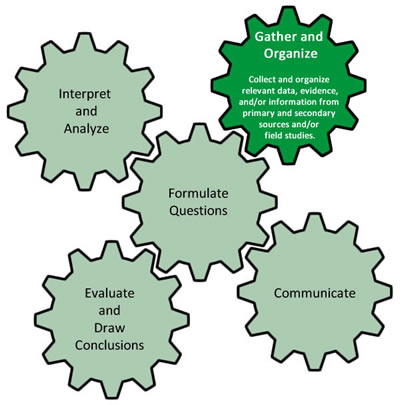
No matter which method you chose, you were gathering and organizing information in the hope of understanding these images. This process of organization is the second stage of the geographic inquiry model we were introduced to in Activity 1.
When gathering and organizing information it is important to use an effective way to keep track of what you find. Balancing this information in your head is easiest and requires the least amount of work. However, it is not the best method for keeping track of information that you might need later. You could use this Two-Column Note Template to better gather and organize information. Refer to this Sample Two Column Note for Image 1 of the Minds On section for an example of how to use this note template.
 Inquiry
Go back and pick one of the image sets from the Minds On section and use the Two-Column Note Template to organize your observations.
Part 2:
Now that you have the ability to organize information, it is time to introduce “Patterns and Trends” - the second concept of geographic thinking. Patterns and Trends involves identifying regions with similar or repeating characteristics.
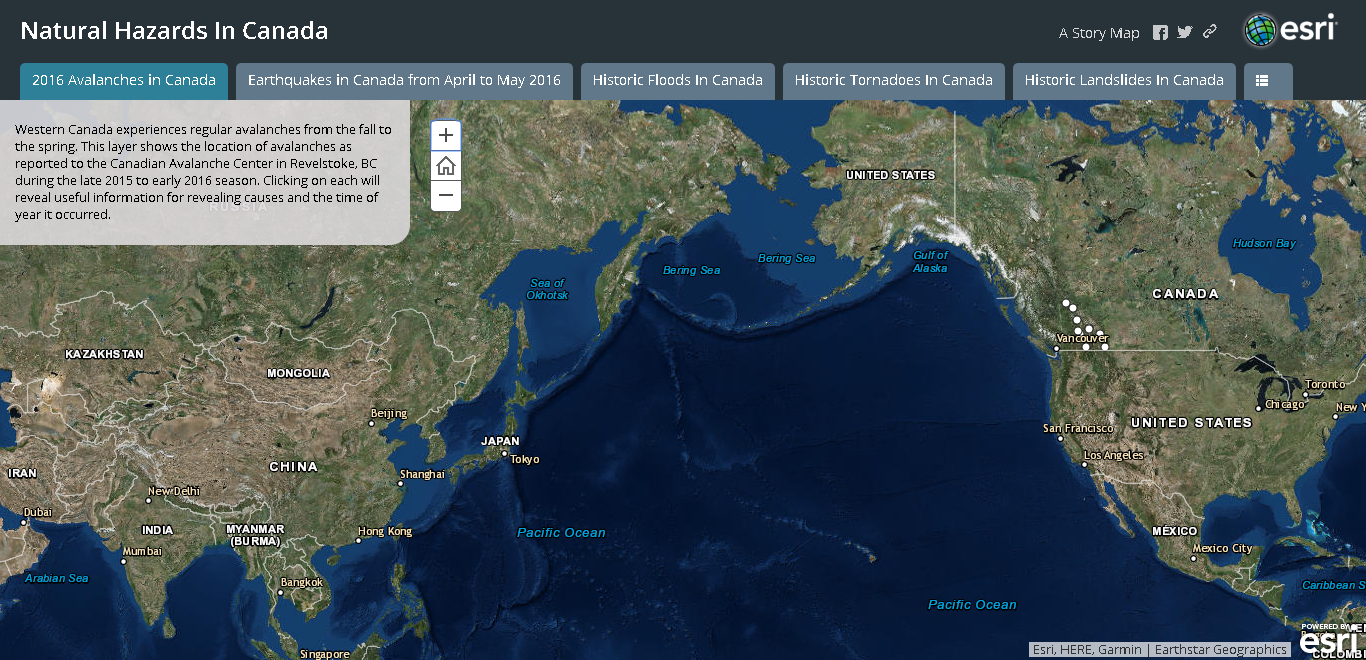
A pattern is a spatial observation that one place/situation proves to be part of a larger system containing the same observation. For instance, most avalanches in Canada occur on the West Coast, where a mountainous landscape exists. The similar landscape as well as the cluster of avalanches occurring there form a pattern.
Pattern
Trends are temporal observations that allow you to study a pattern over time. Not all patterns show trends but many do. To return to our above example, the majority of avalanches in Canada occur from late fall to early spring. The fact that avalanches have an observable “timing” pattern proves the existence of a trend.
Trends
We break patterns and trends up into manageable pieces in order to understand them.
PatternTheory
PatternSample
Completing a Patterns and Trends Analysis
Go back to the Minds On images and choose one of the events for which you will complete a Patterns and Trends Analysis. Use the patterns and trends interactive to guide you through the process. Remember to use the appropriate language for patterns (dispersed, concentrated, etc.) and trends (long term, irregular, decreasing, etc.).
PatternGuide
Self-Assessment Quiz
| Does my paragraph use one of the terms for a type of pattern (concentrated, dispersed, linear, nucleated, absent)? | |
| Does my paragraph use one of the terms for a trend (long term, short term, increasing, decreasing, irregular, predictable, seasonal, static)? | |
| Did I suggest a possible explanation for the observed pattern or trend? | |
| Did I explain the importance of the pattern or trend as I interpret it? |
CONSOLIDATION
Patterns and Trends
Activity 2 has given you all of the skills you need to complete a patterns and trends analysis by gathering and organizing geographic information.
For a natural hazard in Canada:
- a gather and organize a Two Column Note;
- perform a Patterns and Trends analysis.
The following map of natural hazards was created using ArcGIS Online, a mapping program that we will be using throughout the course. There are seven different tabs to choose from but you are responsible for picking only one for this assignment. Submit both the Two Column Note and the Patterns and Trends Analysis.