I Can Think Like a Geographer!
Interrelationships
MINDS ON
Interrelationships exist all around us. Many are easily identified and supported by common sense, like the relationship between hours spent practicing a sport or instrument and success in that area. Even simpler, there is a relationship between the speed a ball rolls down a ramp and the steepness of the ramp. Few would argue that those variables are unrelated. However, what is important to us are the interrelationships we discover between seemingly unrelated geographic phenomena. Geographic interrelationships follow a few simple patterns. Features studied by geographers can be either created by humans or naturally occurring. When identifying interrelationships they can be:
- Human - Human (e.g., The wealth of a country determines how quickly it recovers and rebuilds after a natural disaster.)
- Human - Natural (e.g., Forestry operations destabilize mountain slopes that can lead to landslides.)
- Natural - Human (e.g., The location where hurricanes make landfall affects the cost of home insurance.)
- Natural - Natural (e.g., Volcanoes occur along tectonic plate boundaries.)
To explore interrelationships we will start by using graphs.
GraphIntro
Interpret the graphs below and see if you can determine the interrelationship and its type.
TwoGraphs
You just observed the most popular and scientifically important Natural-Natural interrelationship ever discovered. It has implications for the survival of humans on planet Earth but, surprisingly, it wasn’t fully understood until 1987. Hypothesized in 1896 by a Swedish scientist, it was believed that the burning of fossil fuels and release of CO2 (carbon dioxide) could increase global temperatures. Unfortunately, at the time there wasn't enough evidence to support this wild claim. So, this significant interrelationship went unproven until temperature and CO2 data were extracted from 400 000 year old ice cores in Antarctica during the 1980s. Interrelationships like this are just waiting to be discovered, so let’s go and find them!
 Goal Survey
Take a moment to self-assess and set your goal for this activity. Check off the Success Criteria that you have met so far. Which do you need to work on?
| Success Criteria | |
|---|---|
| I can accurately identify the types and examples of relationships that exist among natural and/or human characteristics (e.g., Human-Human, Human-Natural, Natural-Human, Natural-Natural). | |
| I can describe interrelationships that exist between human and natural characteristics that are relevant to natural hazards and disasters. | |
| I can assess the strength of interrelationships between human and natural characteristics (e.g., Strong earthquakes occur along tectonic plate boundaries; early research suggests that hydraulic fracking could cause an increase in micro-quakes). | |
| I can accurately interpret geographic information presented in various forms (e.g., articles, graphs, tables, maps). | |
| I can accurately interpret geographic data and information using GIS to perform spatial analysis. | |
| I can appropriately use analytical tools to support geographic inquiry (e.g., GIS, remote sensing, spreadsheet functions). | |
| I can make informed judgments using appropriate evidence and geographic thinking. | |
| I can use decision-making strategies to draw logical conclusions from a geographic inquiry. | |
| I can apply geographic thinking concepts with depth to draw conclusions. |
ACTION
Interrelationships
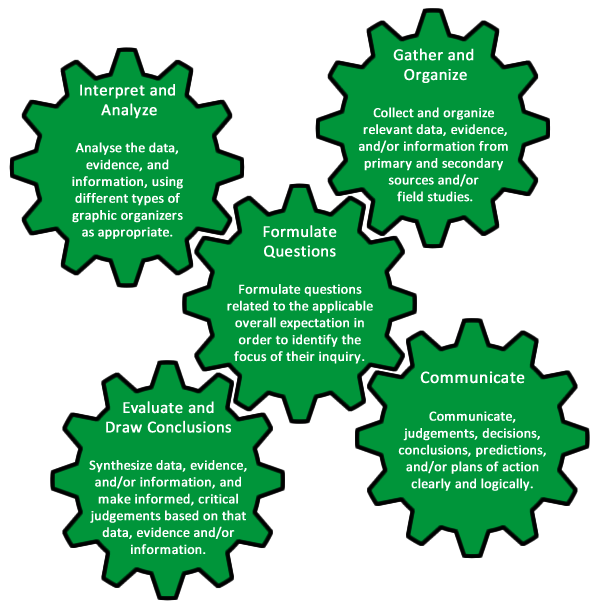
Once you believe that an interrelationship exists, you must follow the five steps that every geographer uses to complete an interrelationship study. An example study has been completed for this topic in the learning object below. Following this framework will help you to think like a geographer by identifying and analysing interrelationships.
InterrelationshipStudy
As you can tell from this study, interrelationships are not proposed as wild guesses or without sufficient evidence. Proving their existence involves using the geographic inquiry process that you have already learned about in the first activities.
| Steps In the Geographic Inquiry Process | Studying Interrelationships |
|---|---|
| 1. Formulate questions. | Propose a link between Feature A and B. |
| 2. Gather information about its features. | Observe each layer in ArcGIS online. |
| Activity 3 will focus on the third and fourth stages of the inquiry process which involve: | |
| 3. Interpret and analyse this information. | Compare the layers showing Feature A and B. |
| 4. Evaluate and verify the relationship. | Decide if Feature A causes/has an impact on Feature B. |
| 5. Communicate your findings and conclusions. | |
While we learn to study interrelationships, it is convenient to also cover two steps in the geographic inquiry model. You have already interpreted (definition:explained the meaning of) and analysed (definition:discovered or revealed) two interrelationships in this activity when we looked at CO2 and Global Temperatures, and then again, when we studied plate boundaries and earthquakes. The fourth and fifth steps of the geographic inquiry model involve evaluating and drawing conclusions from the information we collect or study. In order to practice this, we will introduce a new pair of features that might represent an interrelationship.
- Feature A : The Risk Level of a Natural Disaster in the United States
- Feature B: The Cost of Home Insurance in the United States
Could these be interrelated to one another? Answering this question is our goal, and the geographic inquiry model will help us achieve it.
Information about Feature A and B are available below. You can also download this information if you prefer.
If you want to view any links in this pdf, right click and select "Open Link in New Tab" to avoid leaving this page.
Interpret the information as best you can from either your downloaded file or the pdf above. Make jot notes of your interpretation.
Reading Data
So far in this activity, you have looked at data represented in graphs, maps, and tables. What if this information presented in the table or spreadsheet you are looking at now were displayed in another form, like a graph or a series of maps? How might reading each form for the interrelationships change? What are some benefits of each of the different forms to represent the interrelationships?
Presenting Data and Interrelationships in a Graph
The third and fourth step of the inquiry model involve taking our data and visualizing it in a way to maximize our understanding. In order to do that we will graph Feature A against Feature B, in a similar way that we compared existing graphs of CO2 and Global Temperatures. Use the following steps to create a double line graph comparing the cost of home insurance and the risk for natural disasters in the United States. This activity focuses on the learning skill, “initiative,” as you may have never created a graph like this before. Take the time to learn how to do it correctly, and you will have shown the initiative to learn new spreadsheet skills.
If you want to view any links in this pdf, right click and select "Open Link in New Tab" to avoid leaving this page.
 Interrelationships Study
Take a screenshot of your graph and your interrelationships study generated in the learning object below and submit them to your teacher who will provide feedback on the accuracy and completion of the graph as well as the quality of your interrelationship explanation.
InterrelationshipBlank
CONSOLIDATION
This activity has taught us all about interrelationships and the importance of visualizing information in order to interpret, evaluate, and draw conclusions. There are countless interrelationships that exist when studying natural disasters. To consolidate your understanding, you will try to identify how the occurrence of one type of natural hazard might influence the risk of another type of hazard. An example has been provided for you, but you will submit your own version with different hazards to the class discussion. Remember to use the blank Interrelationships learning object to fill in and organize your information.
 Example
There is a natural-natural interrelationship between forest fires and landslides. Forest fires occur during hot dry periods of weather but landslides often occur during weather periods of increased rainfall. How can an interrelationship exist between hazards with very different origins? It all comes down to timing. When a forest fire burns through a mountainous area, the surface soil becomes exposed and loose, no longer held together by vegetation and roots. If a period of heavy rainfall happens after a forest fire, in the same location, that unvegetated mountain slope becomes unstable. The water saturated soil becomes heavier and becomes much more likely to give way as a landslide. Not all forest fires cause landslides, but this connection is strong enough to be considered interrelated. This results in increased risk to people living in areas prone to forest fires. Not only must they be concerned during a fire, but also on alert for landslides after a fire.
The interrelationship:
Forest fires in mountainous locations increase the risk of landslides within the same location after fire has removed vegetation and the slope cannot absorb heavy rainfall. Read more below.
If you want to view any links in this pdf, right click and select "Open Link in New Tab" to avoid leaving this page.
 Risk
Risk
Now it is your turn… discover a new interrelationship between two of the following natural hazards. This task becomes a little more challenging because not all natural hazards are interrelated to one another. Be careful in choosing hazards,
-
Choose a hazard from the Feature A list, and then choose a hazard from the Feature B list. You cannot choose the same hazard from both lists or the pair used in the example.
-
Do some quick web searches to see if there is evidence to support an interrelationship between your chosen hazards. Include a link to some of the supporting research.
-
Fill out Steps 1-5 in the Interrelationships learning object. Edit the paragraph it creates so that it is grammatically correct.
-
Copy this paragraph along with a concise statement of the interrelationship into your Portfolio.
| Feature A | Feature B |
|---|---|
| Forest Fires | Forest Fires |
| Earthquakes | Earthquakes |
| Tsunamis | Tsunamis |
| Floods | Floods |
| Tornadoes | Tornadoes |
| Avalanches | Avalanches |
| Hurricanes | Hurricanes |
| Landslides | Landslides |
| Volcanoes | Volcanoes |