The Dynamic Earth: How Natural Forces Shape Our Planet
Climatic Processes: Tornadoes
MINDS ON
 Tornadoes
Tornadoes are fascinating weather events that are still not fully understood. They are one natural hazard that seems to have a cult following of both professional and amateur storm chasers who track them for scientific purposes - or, as a dangerous form of entertainment. Watch this footage shot by storm chasers and try to determine if the people shooting the video are professionals or amateurs. How might scientific professionals conduct their work in comparison to thrill-seeking adventurers?
Answer the following questions as you watch the video.
- Level of safety: Did the group operate in what you consider a safe manner?
- Quality of instrumentation: Was the camera shaky? Did it appear connected to the vehicle? Were the vehicles driven outfitted with special gear or were they regular vehicles?
- Composure of the occupants: Did they appear to be as comfortable in the situation as a professional storm chaser might?
- What did you witness in the video? Use geographic language to briefly describe it, as you would for a friend.
This video offers more than just a glimpse into the raw power produced by a tornado. It gives us the opportunity to question who was taking or posting the video and what their intentions might have been. It is the goal of any good geographer to be able to assess and critique the quality and validity of information presented in order to determine its accuracy and usefulness. In Activity 5, we will study tornado formation, use raw data collected from the Internet to create a map of the US “tornado alley,” and then determine the validity of the data source by researching its origins and comparing it to already published maps of tornado alley.
ACTION
Tornadoes happen on every continent except for Antarctica. Occurring in such a diverse range of environments must mean the set of conditions required to spawn a tornado are possible almost anywhere. Though tornadoes can happen anywhere, they most frequently occur in a southern United States region known as tornado alley. It is at this optimal location where we will unpack the atmospheric events that lead to tornado formation. Throughout this activity, we will keep the following inquiry question in mind.
Part 1: Location, Location, Location
Long before a tornado can form, certain atmospheric conditions must be present in order to create a special type of thunderstorm called a "supercell." In order to understand how a thunderstorm develops, we must learn a little about the science of meteorology and weather forecasting. A meteorologist measures conditions and observes processes in the atmosphere.
Simply, the atmosphere has a few "standard" conditions that include:
- Areas of Low Pressure caused by near surface air rising (resulting in cloud cover and precipitation).
Or
- Areas of High Pressure caused by near surface air sinking (resulting in sunny weather and clear skies).
- Cooler temperatures created by a cold front (mass of cold air moving into a region usually from the north).
Or
- Warmer temperatures created by a warm front (mass of warm air moving into a region usually from the south or created by surface heating from the sun).
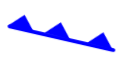
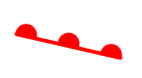
On a weather map these conditions have simple symbols that make them easily identified:
|
|

|

|
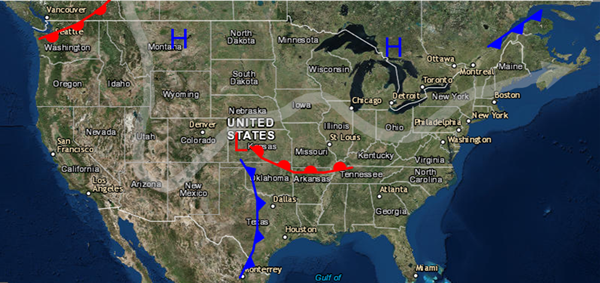
These symbols appear on a weather map as a combination of fronts and pressure regions collectively known as weather systems. High pressure systems are less likely to have fronts nearby. However, low pressure systems are usually associated with a warm front being followed by a cold front. When warm and cold air masses mix, this results in unstable conditions. It leads to precipitation and storms. In contrast, the absence of warm and cold fronts results in stable air and clear skies. When viewing a front, the direction of air movement is indicated by the edge containing triangles (cold front) and semi circles (warm front).
The Jet Stream
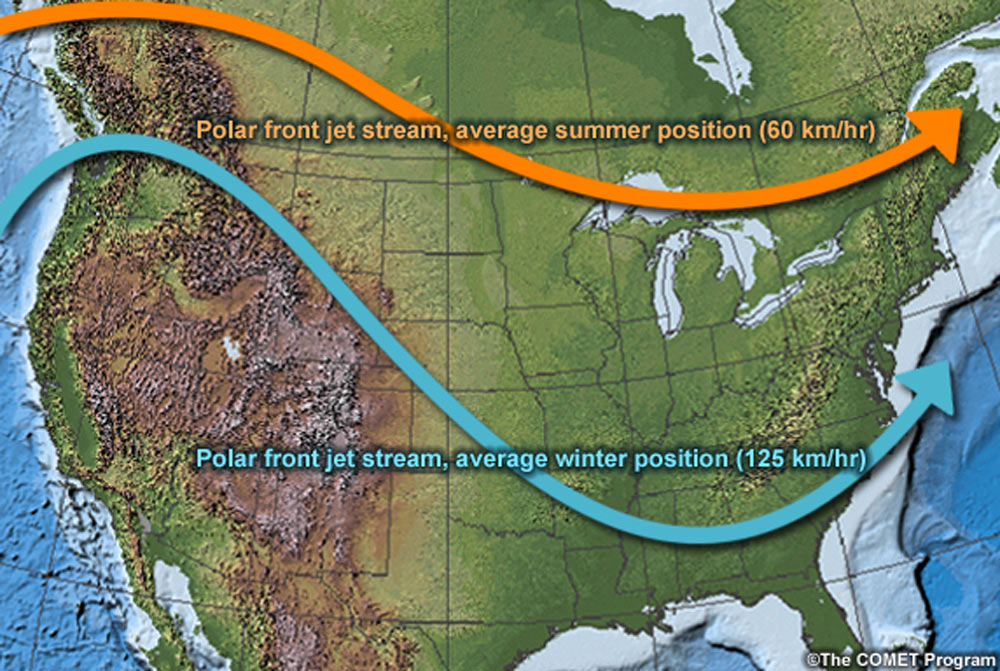
There is another permanent atmospheric feature that is shaped by the location of high and low pressure, as well as warm and cold air masses. The jet stream is one of the most commonly heard meteorological terms but few people understand how it forms or its importance to weather systems. The jet stream is a 70-300 km/h high level wind responsible for carrying our weather systems (highs and lows, storms, and clear skies) from west to east. It is created by the meeting of large continental sized air masses: a cool polar one from the north and a warm moist one from the south.

Thus, the location of the jetstream has an influence on where warm and cold fronts meet; this has an impact on precipitation and temperature. The shape of the jet stream is determined by the location of high and low pressure systems. If you think of high pressure areas as depressions or holes of sinking air, and low pressure areas as mountains of rising air, the jet stream essentially travels around or in between pressure systems as it crosses the continent from west to east.
The jet stream location experiences seasonal shifts as the tilt of the earth affects heating and cooling. During the winter, the jet stream is pushed south by the powerful polar air mass that forms as a result of the northern hemisphere being tilted away from the sun and receiving less solar energy. During the summer, this polar air mass weakens due to the fact that the northern hemisphere is tilted towards the sun and the southern equatorial air mass overpowers it, forcing the jet stream further north.
So what does this all have to do with tornadoes?
-
Tornadoes require thunderstorms that only form when cold air masses meet warm air masses. The easiest way for this to occur is to have the jet stream located overhead as it is the boundary between cold and warm continental air masses. Tornado activity in the southern US is strongest during the spring when the jetstream is still overhead. However, in Canada, tornadoes are most likely to occur during the summer once the jet stream has pushed further north.
-
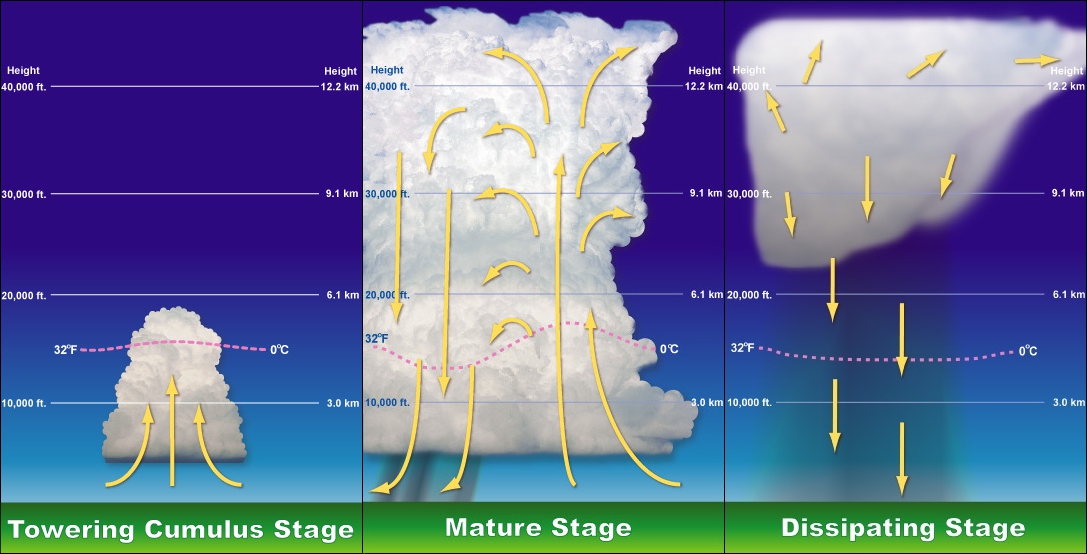
Low pressure weather systems are associated with a leading warm front, followed by a cold front. Cold air is much more dense than warm air. As a cold front approaches a warm air mass, it acts like a bulldozer forcing the lighter warm air upward. Warm air forced higher into the atmosphere will cool it, cause it to condense into clouds, and eventually cause precipitation. Violent collisions between warm and cold air will create towering cumulonimbus clouds that create powerful thunderstorms - and, sometimes, supercells capable of forming tornadoes. Storm systems that form under these conditions are called frontal systems as they are a result of two fronts meeting.

-
The jet stream directs weather systems across the continent but tornado risk is highest near the interior of the continent due to the properties of land. Land heats up quickly and, in turn, warms the surface air. This warmer air is less dense and rises higher into the atmosphere creating an unstable mixture of warm and cold air capable of creating a storm. This form of storm creation is called a convection system. The southern and central United States are ideal locations for convection systems. Here, vast areas of land are available to be heated by the sun and form convection cells.
Part 2: From Thunderstorms to Tornadoes
So far we have studied the conditions that create unstable air capable of forming thunderstorms, but as we all know, not every thunderstorm leads to a tornado. When it comes to tornadoes, it is all about the spin.
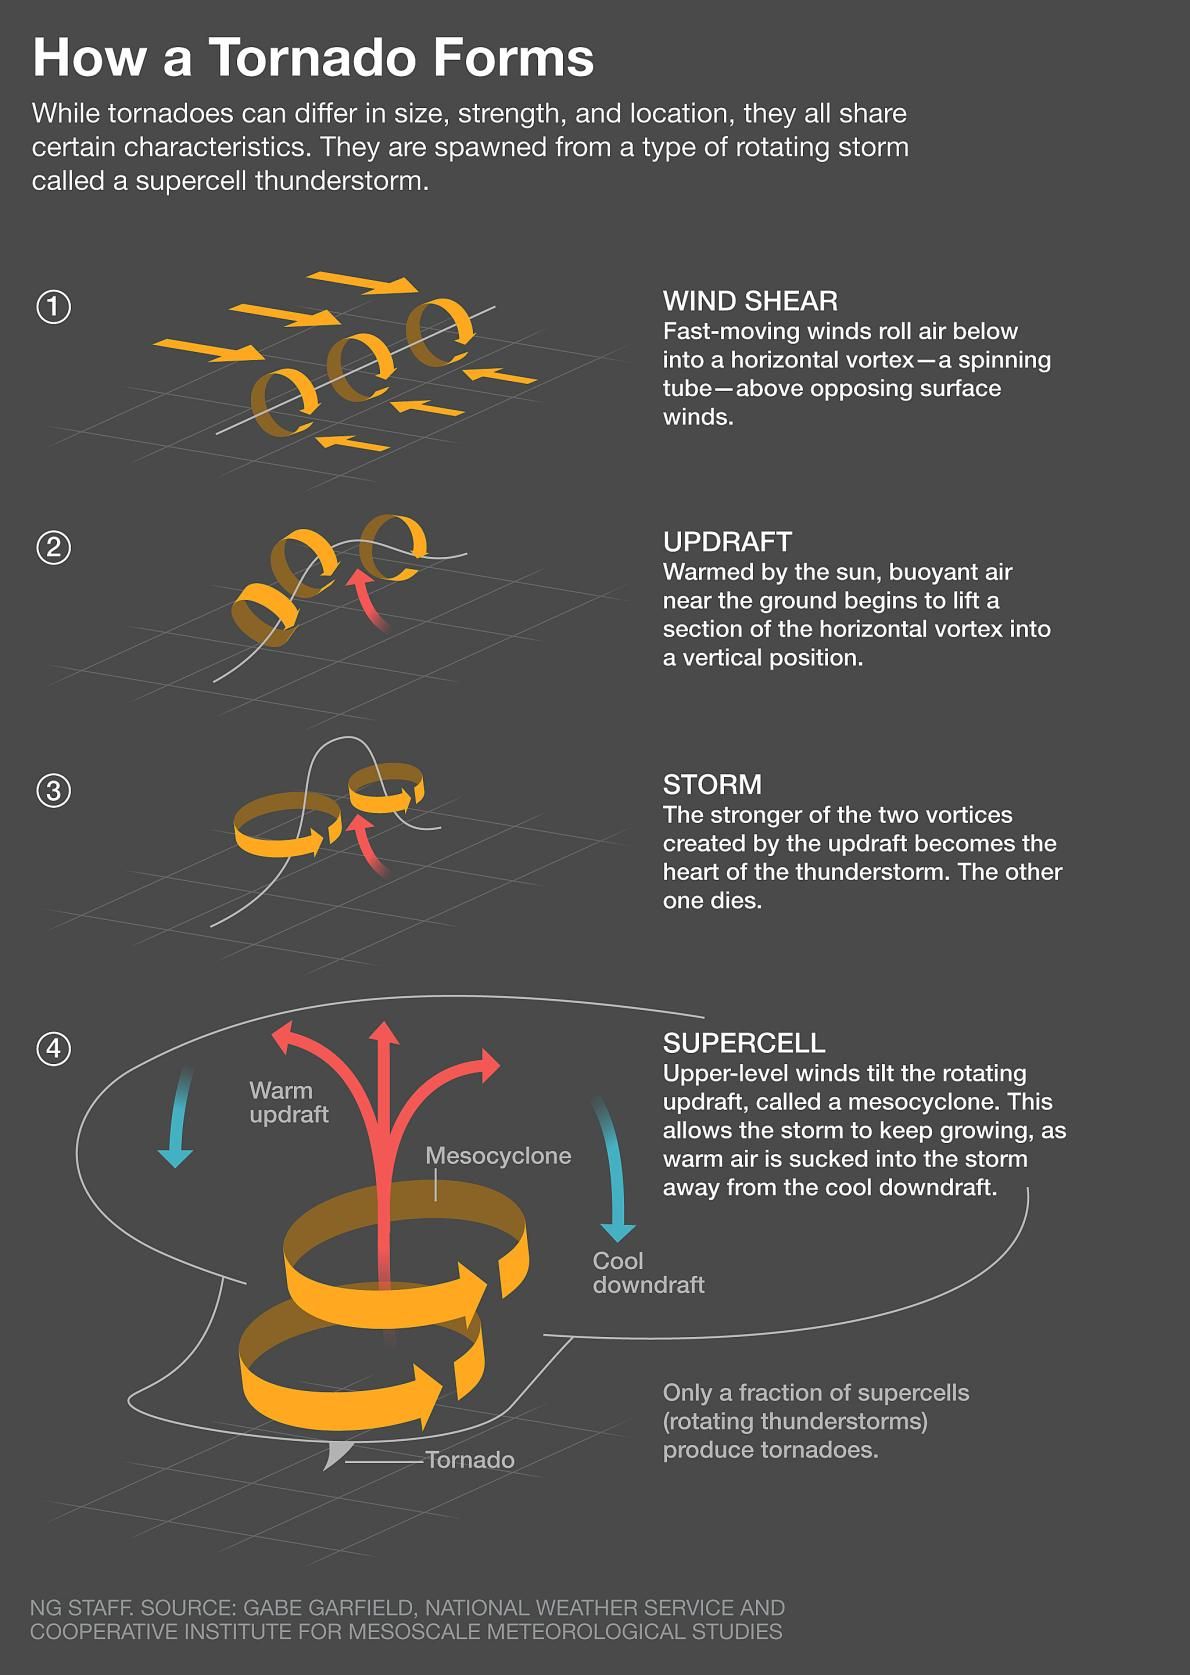
Step 1: As two air masses meet, they are often moving in different directions. In situations where they collide head on a phenomenon known as wind shear occurs. At the location where these air masses are meeting, the turbulent wind creates a horizontal tube of spinning air known as a vortex.
Step 2: As the day progresses, the sun’s energy creates a layer of warm, low density air that rises through the cooler air above, exerting an upward force on the horizontal vortex.
Step 3: With enough warm air rising through convection, the horizontal vortex can be pushed into a vertical vortex and the entire storm begins to rotate.
Step 4: The warm rising air draws in warm surface air through the mesocyclone (the central area around which the storm is rotating). The mesocyclone is an area of extremely low pressure which sucks in surrounding air in an attempt to equalize pressure. It is important to note that any wind you experience is simply a mass of air moving from a region of high pressure to a region of low pressure. The winds associated with tornadoes are just stronger, created by a much larger difference in air pressure inside and outside of the storm.
Step 5: Under these conditions, with enough power, the vortex narrows and wind speeds increase as it reaches toward the ground. This is the first sign that the rotation is powerful enough to create a tornado. This is termed a funnel cloud. If the funnel cloud is sufficiently fed by rising warm air through the mesocyclone, and rotation is maintained, the funnel can extend to the ground and touch down as a tornado.
Check out the infographic below for a visual interpretation of the steps above. Remember that seeking out information in a variety of forms will aid in your depth of understanding. The information presented in this course is just a small fraction of what could be researched and understood about tornadoes. You are encouraged to dig deeper and look outside this course if tornadoes interest you, or if you have chosen this natural hazard for your culminating activity.
used in article “How Tornadoes Form and Why They’re so Unpredictable”
by Brian Clark Howard, National Geographic,
PUBLISHED MAY 11, 2015
At this point, it is a good time to step back and consider the inquiry question that was posed at the start of the action section.
Part 3: Visualizing Tornado Alley
You will create a tornado map using ArcGIS Online and screenshot tools that communicates geographic information in an effective way.
Instructions: Creating the Map
-
Download and save a copy of the 2015 US tornadoes dataset to a known location on your computer. The dataset was taken from the National Oceanic and Atmospheric Administration (NOAA).
-
Login to ArcGIS Online and choose Map from the tab along the top of the page.
-
Click the add button and choose “from file.” We will add the tornado dataset to your blank map.
-
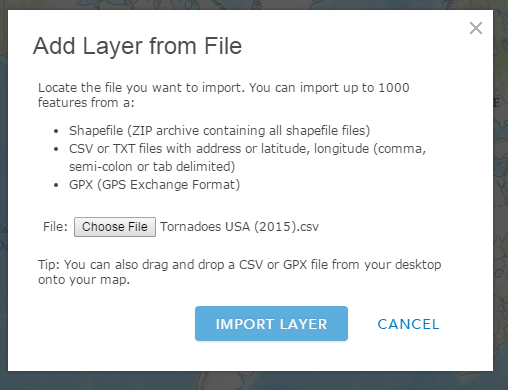
Navigate to the folder where you saved the dataset and and choose it for upload. The screen should look like this.
-
Click “import layer” and choose “yes, continue adding features” to the pop up warning.
-
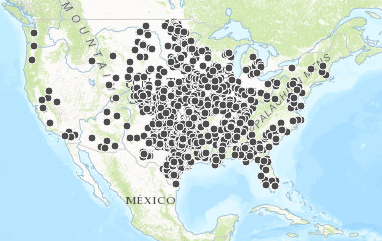
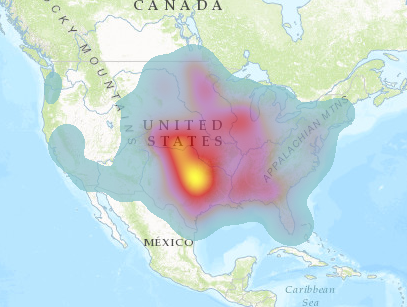
Your map will appear with a large number of black dots representing all of the tornadoes that touched down in 2015.
-
On the left side of the page you will be prompted to “change style.” Beside the blue circle labelled 1, choose “ show location only.
-
Beside the blue circle labelled 2, choose heat map.
-
Your map should now appear as follows.
-
Click “Done” and the map will now be full screen with your layers visible on the left side.
-
Save your map by clicking the “Save” tab along the top. Your map will be available in the “My Content” location of your ArcGIS Online account.
Communicating Your Map Effectively
ArcGIS Online is a great tool for creating and manipulating map layers as you did in the above exercise, but in order to communicate effectively, you must create a map with all of the components of map design. For this, we will use screenshots pasted onto a template. You are also welcome to create your own template using a familiar program.
- Keep a copy of your map open in one browser tab and use another browser tab to access the map template. Create a similar one in a program of your choice.
- Take a screenshot of your map area so that all of Continental USA (Alaska and Hawaii can be left out) is included. Paste this into the map area of the template.
- Repeat Step 2 to add the legend and scale bar to your template.
- Write short description of your map and its purpose.
- Add your name beside Cartographer's Name.
 Did You Know?
- Add the Date.
- Create an informative title by using language that informs the reader of the map's content.
- Consider changing the map background or adding aesthetic features to the document. After spending the time to create the map, it only makes sense for the entire document to be visually pleasing. Click here for an example of how the template can be turned into a themed map.
- Save a copy of your map.
- You will use this self assessment tool and reflection to determine how well you have communicated geographic information in the form of a map.
Part 4: Assessing the Credibility of the Geographic Data
When searching for data used in GIS map making, your map is only as good as the dataset used to make it. Rarely do we collect our own primary data (definition:raw data collected by you.). Most often, we use secondary data that has been collected by someone else. Information such as longitude and latitude coordinates, dates, and other attributes of the data points must be accurate or else you risk creating an inaccurate and misleading product. The tornado dataset was taken from the National Oceanic and Atmospheric Administration (NOAA) website.
 Assessing Credibility
Go to NOAA website and figure out who or what the NOAA is. Answer these questions to help determine whether the website/organization used in this activity was a reliable source.
- What is NOAA and which administrative body is in charge of it? Is it a private business? private organization, government, or an academic institution?
- Does NOAA appear to be a reputable source for data? Why or why not?
- Why do you think it is important to know and use data only from reputable sources?
- Devise a way you could assess the accuracy of your "tornado alley" map.
CONSOLIDATION
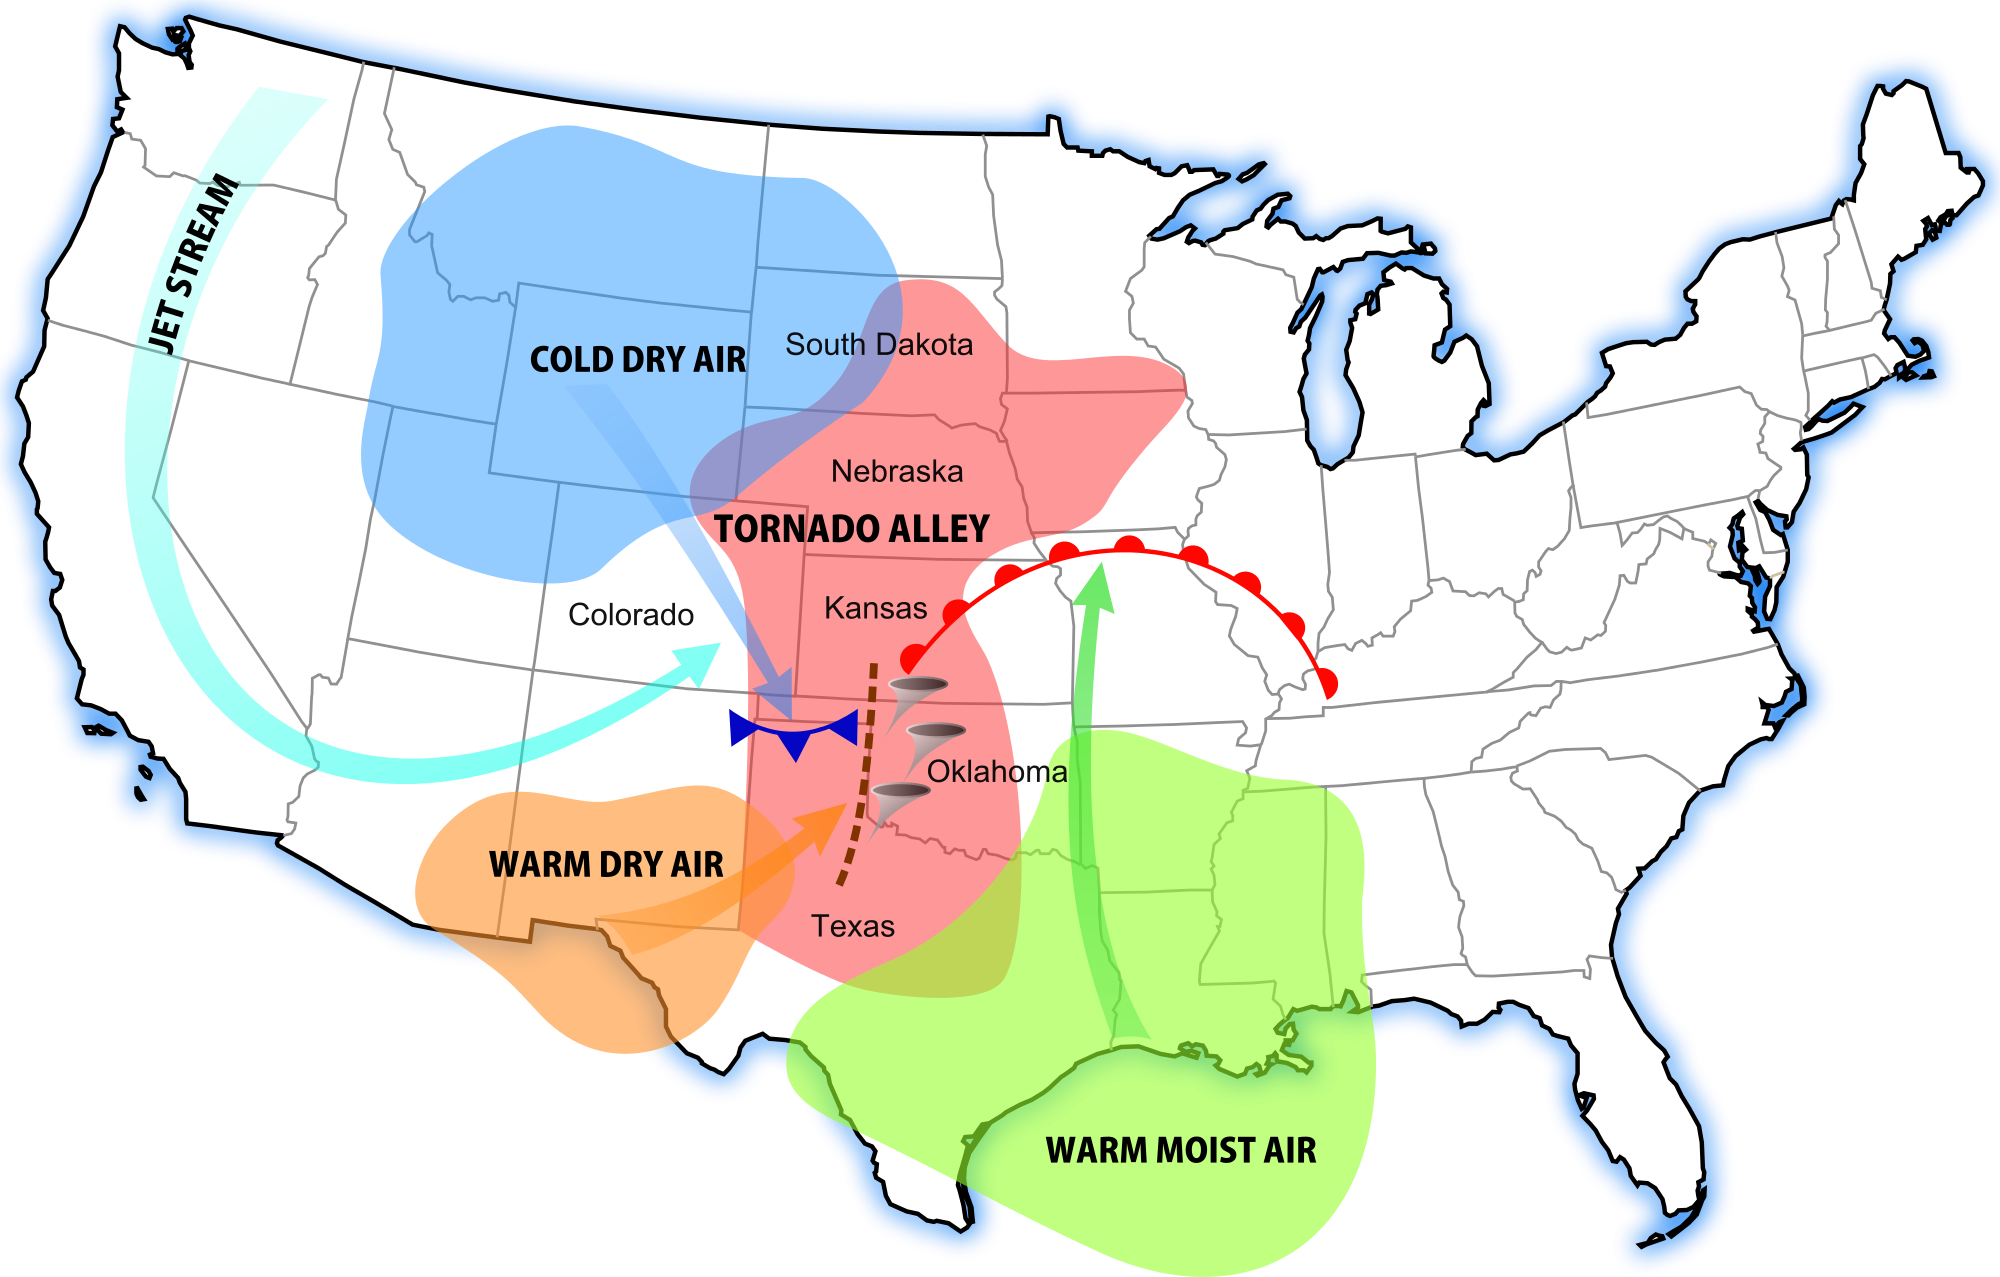
The map below was also created by a person associated with NOAA. It not only shows the location of tornado alley but also the conditions that influence tornado formation. Summarize your understanding of tornadoes by completing a spatial significance analysis of tornado alley. Use the map below, your own map, the information contained in this lesson, and any outside research to communicate the answer to the original inquiry question for this activity.
Spatial Significance Paragraph
Use the spatial significance learning object below to help organize and write your spatial significance paragraph.
For this activity, spatial significance includes the:
- ability to describe the extent of tornado alley;
- ability to explain the natural processes that lead to tornado formation;
- ability to briefly research and explain human activity in tornado alley;
- ability to explain how human activity and natural processes interact (people live and work in tornado alley); and
- ability to explain how tornado alley is a unique location based on its natural characteristics and human activity.
SpatialSignificance