CGW4U
World Issues: A Geographic Analysis
Unit 1: Understanding World Issues
Activity 2: How do our preconceived ideas limit our understanding of world issues?
There are three kinds of lies: lies, damned lies, and statistics.
By definition world issues are complex and difficult to study. The information we use can be biased, out of date, and even plain wrong. The challenge for us is to identify and acknowledge any preconceived ideas or misconceptions that may limit our understanding of the issue at hand. We will have to proceed thoughtfully in order to learn about the truth about any given issue.
For example, it's really important that when we need to gather data, we gather it from reliable sources. If we don't do this we can unknowingly spread misinformation that can be damaging to the people who are most closely connected to that issue. Have a look at the 8 graphs in the interactive below that illustrate how statistics may be used to confuse and even lie about the data at hand.
Initially, could you find the manipulation in each of these 8 graphs? While some were more obvious than others, they do illustrate how easily media outlets either make mistakes or willfully work to mislead the reader. Neither of these situations is going to increase our understanding. In reality they may make a bad situation worse.
 H.O.T. Topic - Interpreting Graphs
Scenario
After viewing all 8 graphs in the above interactive, consider the following question: What important factors must be considered when interpreting data in graphs? Write one TIP which begins with: “When interpreting graphs, always make sure you…”
Social Action?
Who might benefit from receiving your list?
When used correctly, statistics, and the graphs we make from them, allow us to visualize the relevant patterns and trends that are occurring in the world around us. They can remove bias and increase our understanding of complex data. Hans Rosling’s The Joy of Stats uses thousands of pieces of data to show how 200 countries have changed in 200 years. The details are still there in the graph, but the big patterns and trends are easily visible. As he says “Pretty neat eh?!”
Rosling goes further in his 2014 TedTalk, Hans and Ola Rosling: How not to be ignorant about the world.
Consider his three reasons for our ignorance about World Issues. Do you feel you have a personal bias when it comes to World issues? Is your worldview outdated? Is your news source biased? If so how?
Paradigms
Sometimes the way we experience the world around us is through a point of view we don't even realize we have. We might call this our worldview. It can also be called our paradigm. A paradigm is a set of assumptions, concepts, values, and practices that make up our way of viewing and interpreting reality. We can have our own individual paradigm, or we may share one with our community.
We need to think about how our perceptions and existing ideas limit our ability to understand world issues. To complicate the situation we must also carefully make generalizations. Rosling used thousands of pieces of data for his 200 countries in 200 years illustration of visualizing data. In many cases people generalize data as protection against getting swamped by the very data we are using. We need to proceed with caution here. What we see may not be as it appears. This is the message in the video: “How not to be ignorant about the world.”
We must consider our own paradigms if we are to find and account for our personal bias, or challenge ourselves to hold a worldview that reflects the world today and not the world from a decade or two ago.
The trick with paradigms is that once we invest in a paradigm (e.g., dogs make better pets than cats) we may block out reasons to rethink the original paradigm. In most places a worldview about which makes the best pet is not likely to change the events of the world. If however the paradigm is that one group of people are inferior to another group of people we could be sewing the seeds of a cultural genocide.
A paradigm, held by an individual, a group, or a civilization may preclude or block us from seeing other possibilities. Paradigms then, are perspectives from which we view issues and develop solutions. Unconsidered, we move through life seeing what we want to see, not what is actually there.
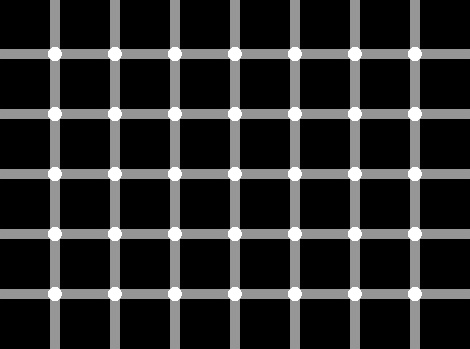
What do you see?
Count the white and black dots in the visual below. Would you come up with the same number as someone else would?
What do you see? A bunny or a duck?
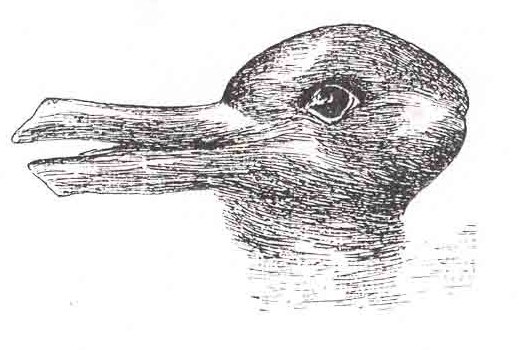
In both of these cases all answers are “correct.” Both images have been constructed to make your brain question what you are seeing. You may have seen the duck or the bunny first, but once you set your mind on seeing both, they become quite visible.
We can take this further. Our worldview can be challenged in a similar way. Even in the real world we can be challenged to move past the easily visible to develop a deeper understanding of world issues.
Who to Believe; a temporary art installation in Paris provides a perfect illustration of a worldview where what you see at first may not be the reality you ultimately come to understand.
Sometimes our worldview or paradigm falter. Anomalies or inconsistencies arise challenging what we thought to be “true,” and so we must alter the way we perceive, think, and value the world. We must take on new assumptions and expectations that will transform our theories, traditions, rules, and standards of practice. We must create a new paradigm with which we are able to solve the insolvable problems of the old paradigm.
An example of a geographic paradigm would be about how many continents there are. This is something fairly concrete and easily determined, or is it?
When we have a paradigm, we gather new information, test old information and in some cases we experience a paradigm shift where our assumptions are forced to change as we take on new information and understanding. In this example it probably doesn’t matter how many continents exist. We can agree to disagree. If, however, the topic helps us develop international policies or levels of aid we might work diligently to get consensus on our paradigm. What does it mean to be a “developing country?” If a country fits the criteria of “developed,” as opposed to “developing” it could change their ability to encourage international investment. Advocates for International Development (A4ID) describe the challenges and consideration necessary when determining the level of development for any individual nation.
 Issues Café: Maps and Paradigms
As you go through the maps, consider how you would answer the following questions:
- Why do we classify countries in this way?
- What are some of the consequences of placing a country into a particular category?
- How might this type of categorization help to maintain stereotypes rather than promote understanding?
Click on the bottom right corner of the World Issues Atlas to begin.
 Enrichment
How do our preconceived ideas limit our understanding of world issues? This is a question Why Google Maps gets Africa Wrong works to answer.
H.O.T. Topic - Promoting Understanding
Scenario
Do our present ways of classifying countries help create stereotypes rather than promote understanding? You will create a news headline and brief (less than 100 words) article that depicts a common perception of a specific country. Include the country’s classification, a common stereotype and brief explanation. Do not include the country’s name. Use the Newspaper Generator to create your headline and article. For a developed country like Canada you might see something like this…
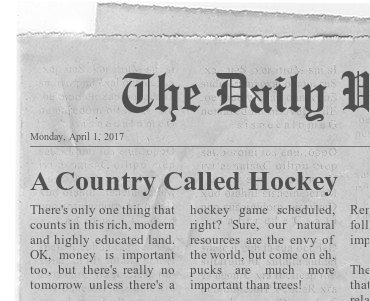
Does our world view promote understanding or create stereotypes?
Social Action?
What actions can individuals take to ensure that they are promoting genuine understanding rather than creating misleading stereotypes?
Why Some Countries Are Poor and Others Rich
Before you watch Why Some Countries Are Poor and Others Rich, think about the way we use indicators.
- Why is it important to look at a variety of indicators from different categories (economic or social) in order to make a balanced assessment of conditions in a certain country or region?
- What does an indicator like GDP per capita or GII tell us about a country?
- What doesn’t it tell us?
- How can the use of such indicators cause us to make misleading generalizations about a country or to stereotype its people?
Looking at maps - their content and their projection - is not just a simple classroom activity. Maps can be both a cause and a solution to a range of geopolitical issues. The West Wing illustrates the implications of using a particular projection.
 Think About...
Once you have watched this video clip, ask yourself:
- Have you ever considered the implications of the projection of a map you are using?
- When considering the data that is plotted on the map, why might different organizations or countries choose one type of classification but not another to support their opinions?
- How might these organizations or countries manipulate the data to strengthen their message?
- Why is it important to note how and where the data were obtained and who interpreted them?
World Issues
What do you consider to be an important world issue today? Choose just one and describe it very briefly in 3 to 5 sentences. Select a minimum of 3 indicators that would be used to analyse the impacts and state an advantage and a disadvantage of each. The video you watched above should assist you when considering indicators.