Fundamentals of Economics
Scarcity and Choice
MINDS ON
 City Budget
You have received the following email from a local Mayor.
TO: Committee Members
FROM: The Mayor
SUBJECT: Infrastructure Budget
I am asking you to join this committee to help me solve a problem. The city tax revenues are projected to be $600,000 less than expected this year, the third year in a row. That means we might have to cancel several projects or raise taxes. Unfortunately, I promised in the last election campaign to complete all of the scheduled spending projects without increasing taxes. I will have to face the electorate next year and justify my decisions.
In making your recommendation, please use the information included here. Note that the total cost of the projects is $1,200,000, but only $600,000 is available without an unpopular tax increase and no additional funds can be obtained by cutting existing programs in the city’s budget.
Within these limits, make whatever choice you think is best: eliminate all the proposed projects and cut taxes; complete all the projects and raise taxes; or work out some combination either of project cuts and tax cuts, project cuts and tax increases, or project cuts and maintain taxes. You can decide to cut one part of a project and keep another. For example, you can suggest fixing only two street lights, one sewer, etc. Be specific about which projects, if any, will be cut and by how much taxes will be raised or lowered, or whether they will be maintained at the same level.
REMEMBER: There is a lot of pressure to hold tax increases to zero. My opponent in the last election is already mounting a strong tax repeal campaign.
Project Expediture Table: Summary Data
Project |
Budget Line |
Cost |
Total Project Cost |
Details |
|---|---|---|---|---|
|
Firefighters: Station #1 |
A152a |
$60,000 |
$180,000 | Due to previous budget cuts there has been a three year hiring freeze, each of the city’s three stations is short one firefighter. The problem is playing havoc with the fire chief’s personnel scheduling. This means the city must pay time and a half overtime pay. Each added firefighter would cost $60,000 in salaries, benefits and equipment, but would lower the costs in overtime and improve the response to emergencies. |
|
Firefighters: Station #2 |
A152b |
$60,000 |
||
|
Firefighters: Station #3 |
A152c | $60,000 | ||
|
Day Care Centre |
B74a |
$120,000 |
$120,000 |
A city-funded day care centre for low-income families has been proposed in order to allow single parents who are currently on Social Assistance to find jobs or go back to school to get job skills training. Day Care Centre advocates say that getting people back to work will save taxpayers money in the long run. Staffing and equipment will cost $120,000. |
|
Street Lights: First Street |
C10e |
$30,000 |
$120,000 | Four streets are without adequate street lights. The residents and the police are concerned about crime and vandalism, especially on Third and Fourth (high crime areas). Also, many children play outdoors in the evenings on First and Second, which are residential areas. One little girl was badly injured when hit by a car on Second last year. Each street light project will cost $30,000. |
|
Street Lights: Second Street |
C10f |
$30,000 |
||
|
Street Lights: Third Street |
C10g |
$30,000 |
||
|
Street Lights: Fourth Street |
C10h |
$30,000 |
||
|
Road Repair/widening: Hwy 007 |
C11c |
$240,000 |
$480,000 | Hwy 007 is the main highway that services the city. It has not been resurfaced in 10 years and is in critical need of widening due to increased truck volume and commuters coming to work in the city. Load limits might have to be put into place costing businesses more money in the long run. The Maple St. Overpass will allow delivery trucks to bypass the downtown core to make their deliveries and will decrease time and costs for businesses. Each road upgrade will cost $240,000. |
|
Road Repair/widening: Maple St. Overpass |
C11d |
$240,000 |
||
|
Sewer Repair: Old Poplar St. Storm Sewer |
C36a |
$120,000 |
$240,000 | The sewers in the city are approaching 100 years old and have not been upgraded in that time. Heavy spring and summer rains invariably cause flooded basements. Some people’s yards become bogs with ruined lawns and flower beds. Residents in the area are very upset. Upgrading the sewers was a key part of my platform in the last election. Sewer repair for each area is $120,000. |
|
Sewer Repair: Old Elm St. Storm Sewer |
C36b |
$120,000 |
||
|
Parks: Stephenson Park |
F24c |
$30,000 |
$60,000 | For some time it has been evident that the present park system is inadequate because of the many new families with young children living in the city. Stephenson and Johnson parks have been delayed three times due to lack of funds. The city has received two federal grants of $30,000 each to develop the two parks, but the grant depends on the city matching with an equal amount of money. Thus, if funding one park is eliminated, the $30,000 grant for that park is lost. Each park costs $60,000 of which $30,000 would come from a federal grant. |
|
Parks: Johnson Park |
F24d |
$30,000 |
Recommend a course of action for the Budget Committee.
 Budget Reflection
Reflect on the budget exercise. Use the prompts below to write a paragraph.
- What was the basic problem you faced?
- What criteria did you use to make your decisions (individually and as a group)?
- How did you resolve differences in your group?
- How realistic was this simulation? Did it mirror the “real world?” Explain.
Scarcity, the Basic Economic Problem
Watch the following video paying close attention to the vocabulary.
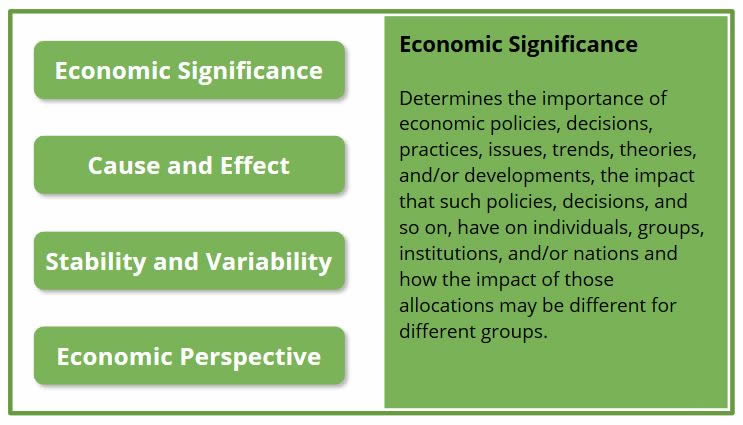
Economic Thinking Concepts - Economic Significance
 Features of an Infographic Checklist
| Yes/No | Criteria |
|---|---|
|
|
Highlights a great deal of reliable and interesting data |
|
|
Focuses on important or relevant topic |
|
|
Presents information simply (and visually) |
|
|
Creatively visualizes data and information |
|
|
Focuses on one topic |
|
|
Uses accurate and current statistics visually |
|
|
Provides sources (credibility is important) |
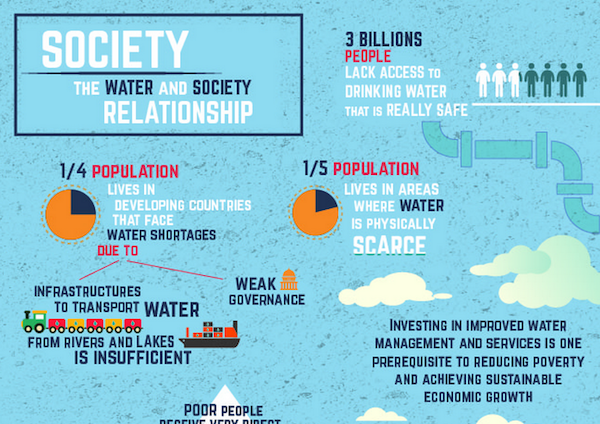
Scarcity
Using the Features of an Infographic checklist above, how effective is this infographic? What overall score would you give this infographic? What is the most economically significant data in this infographic? Why?
ACTION
 Opportunity Cost
Read the following article from the New York Times and:
- Find evidence to support or challenge the article’s use of evidence.
- Cite sources fully and accurately (in alphabetical order).
If you want to view any links in this pdf, right click and select "Open Link in New Tab" to avoid leaving this page. (View the original article.)
Scarcity and Financial Literacy
Financial literacy is sometimes called one of the most important life skills you will need. Much of what you will learn in Economics will help you make more informed choices about your life, as well as understanding the world around you.
Now, watch this quick video on emergency funds. As you watch it, think about your own life and what you might want to do differently.
Government of Canada, Money and Finances Advice
Read the articles that are of interest to you on the Government of Canada, Money and Finances website, and reflect on the following:
- three things you learned.
- two things that surprised you.
- one question you still have.
Production Possibilities Curve (PPC)
We all make individual choices such as which concert to go to and incur opportunity costs such as the missed concert. However, communities and nations also need to make those choices, as you saw in the Minds On. How do economists demonstrate that phenomenon? One way is to use the Production Possibilities Curve (PPC).
 Questions
Consider the following questions as you examine this graph. Once you have an answer, compare your answer with the correct one.
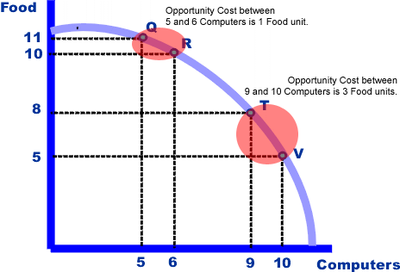
- What are the trade-offs involved?
AnswerThe choice between computers or food.
- How is scarcity and opportunity cost depicted in this graph?
AnswerThe graph represents the choice between food and computers, because there are not enough resources for both. The opportunity cost is what must be given up (sacrificed) to increase production of one item.
- What would a point on the curve (such as point T) represent?
AnswerThis represents the outer limit or maximum output for the two products. Producing anywhere along the PPC assumes all productive resources are fully employed.
- What would a point inside the curve (such as 6 computers and 8 units of food) represent?
AnswerThis point would represent underutilization of resources or unemployed resources.
- What would a point outside the curve represent?
AnswerA point outside the curve would not be attainable with the current resources and technology. It is not currently possible. To shift the curve to the right requires economic growth through an increase in quality or quantity of resources such as new technology (quality) or additional resources through increased immigration (quantity).
- Explain why the cost of the addition of the 10th computer has a greater opportunity cost than the increase in production from 5 to 6 computers?
AnswerThe resources used to produce these two goods are different. Some resources can easily be shifted from one to the other. As more resources are shifted, they are less efficient. e.g. workers need to be retrained.
Graphing
 Practice
Use the following data to create a graph. Be sure you have graph paper. Label the x-axis as ploughs and the y-axis as bread. After plotting the points, connect them to form a curve.
| Ploughs | Bread | |
|---|---|---|
| A | 0 | 16 |
| B | 1 | 14 |
| C | 2 | 12 |
| D | 3 | 9 |
| E | 4 | 5 |
| F | 5 | 0 |
Self Assessment:
- Are both axis labeled accurately?
- Are the points accurate?
- Are the points connected to create a curve?
- What would a point at (5, 8) mean?
AnswerWhen a point is read, it refers to (x,y) so you would find how many ploughs (5) and how many bread (8) and this would be outside the graph, so not possible.
Applying Opportunity Cost
Using the concept of opportunity cost and scarcity, explain one of the following questions. Make a connection to something you have observed.
- Many Canadians today seem to be much more pressed for time than were their grandparents. This is rather odd in view of the fact that today’s homes are full of so many time-saving devices for which our grandparents had no access. How would you account for this?
- TV and radio networks offer “free air“ for public service announcements. What is the cost of this “free” time for the station? Why are there more public service announcements on Sunday than other days of the week?
- The acres of grass surrounding the Taj Majal in Agra, India are often cut by young women using kitchen shears instead of lawn mowers. Is this a low or high cost way to cut the lawn?
- Why, on a rainy day would farmers go into town to do errands, while a business person who lives in town forego their errands?
Questions
- Consumers will seek out the lowest prices for goods and services to maximise their consumption.
- Ceterus Paribus
- Model
- Positive economics
- Normative economics
c. Positive economics
- Gas stations should not be allowed to raise their prices suddenly before long weekends.
- Positive economics
- Variables
- Normative economics
- Fallacy of composition
c. Normative economics
- Why do economists often use ‘guns’ and ‘butter’ as alternatives when explaining PPCs? What do these goods signify?
- We always have only two choices in life.
- Guns represent military goods and butter represents consumer goods and some countries make different choices.
- Guns require more capital than butter so it makes for a good comparison.
- Both b and c
b. Guns represent military goods and butter represents consumer goods and some countries make different choices.
- Which of the following are needs?
- Food, lunch at expensive restaurant, clean water
- Bottled water, bagged lunch, movie with friends
- Bagged lunch, clean water, clean air
- Drive through coffee, clean air, bagged lunch with friends
c. Bagged lunch, clean water, clean air
- What is the opportunity cost of increasing hockey stick production from 2 dozen to 3 dozen?
Dozens of Hockey Sticks Pairs of Skates 2 11 3 9 4 7 5 5 6 3 - 11 fewer pairs of skates are produced
- 9 fewer pairs of skates are produced
- 2 fewer pairs of skates are produced
- 2 more pairs of skates are produced
- Can’t tell with this data
c. 2 fewer pairs of skates are produced
Economic Thought
Throughout the course you will be given the opportunity to explore the history of economic thought through examining primary sources. Here is an example of what is known as the paradox of value. As you can see, we all face scarcity and must make decisions. Those decisions reflect what we value, as individuals and communities.
Read the following excerpt from Adam Smith’s most famous book, The Wealth of Nations.
“
The word VALUE, it is to be observed, has two different meanings, and sometimes expresses the utility of some particular object, and sometimes the power of purchasing other goods which the possession of that object conveys. The one may be called ‘value in use ;’ the other, ‘value in exchange.’ The things which have the greatest value in use have frequently little or no value in exchange; and on the contrary, those which have the greatest value in exchange have frequently little or no value in use. Nothing is more useful than water: but it will purchase scarce any thing; scarce anything can be had in exchange for it. A diamond, on the contrary, has scarce any value in use; but a very great quantity of other goods may frequently be had in exchange for it.


Economic Ideas At Work
After reading the excerpt from Adam Smith’s most famous book, The Wealth of Nations, and looking at the two photos, answer the following questions:
- Which is more precious today?
- What about in 25 years?
Applying Economic Thought
Now watch this video about Canada having abundant water, yet water in many Indigenous communities in Ontario is not safe to drink. As you watch, think about how scarcity and value influence economic choices and decisions. Who should be responsible for safety of drinking water? What can you do about this? Record your thoughts and retain them for later use.
Economic Systems
Throughout time, economic systems have evolved to answer the problem of scarcity by focusing on the following three basic economic questions:
- What goods and services should be produced (and how much)?
- How should these goods and services be produced?
- For whom should these goods and services be produced?
How these questions are answered depends on the economic system. An economic system is the set of laws, institutions and common practices that help a nation determine how to allocate their scarce resources to satisfy people’s needs and wants. Historically there were three basic systems: a traditional economy, a command economy and a market economy, but more recently, a fourth has developed, called a mixed economy. As you watch this, think about how would you characterize the economic systems of Canada, Cuba, and Sweden? What impact do (what to produce, how to produce and for whom to produce) systems have on how these countries make decisions about production?
Comparing Economic Systems
Create an infographic to compare how these three economic systems answer the three economic questions. Be sure to review the features of an effective infographic in the minds on in this activity.
Matching
In this course you will be doing a lot of research and it's important to know whether your sources are appropriate and authoritative. This is a great interactive to introduce you to some of the things that you need to think about when evaluating sources.
CRAAP
CONSOLIDATION
Financial Literacy
Select ONE of the following financial choices and explain the costs and benefits in a T chart.
- Saving for a large purchase or spending on something you want today.
- Student line of credit or student loan, post secondary education or getting a job after high school.
- Renting or buying a home.
Criteria:
- What is the opportunity cost for each choice?
- Explain your decision.
Watch the following video:
Putting it All Together
In a paragraph, select ONE country (excluding Canada, Cuba and Sweden) and explain where it lies on the continuum of command - mixed - market economies. Be sure to do some research. Refer to the CRAAP test to ensure the source you have chosen is credible. Include evidence to support your decision.
Criteria:
Use third person, paragraph structure (topic sentence, concluding sentence, body, evidence).