Macroeconomics
Macroeconomic Measures and Models
MINDS ON
Macroeconomics is the branch of economics that studies the behaviour and performance of an economy as a whole. It looks at the aggregate (definition:Total; formed or calculated by the combination of many separate units or items.) changes in the economy such as the unemployment rate for the country, rather than the impact of unemployment on a single family. As you look at the business cycle image below, what questions do you have? You might want to know some definitions of these terms, as well as, the causes and effects of these changes?
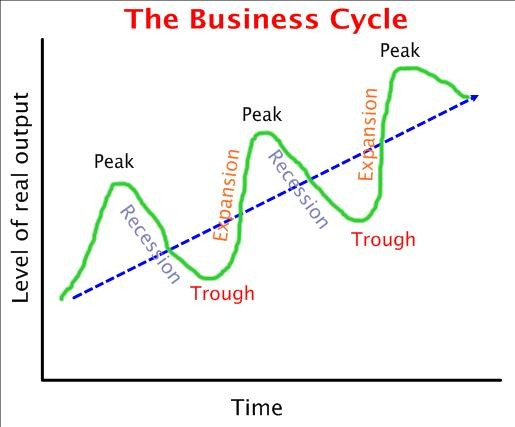
- Recovery/Expansion: This is the phase of the business cycle when the economy moves from a trough to a peak. It is a period when the level of business activity surges and gross domestic product [GDP] expands until it reaches a peak. A period of expansion is also known as an economic recovery. Prices are rising, and unemployment falls.
- Peak: This is the highest point between the end of an economic expansion and the start of a contraction in a business cycle, with low unemployment and rising prices.
- Recession: This is the phase of the business cycle when the economy moves from peak to trough. It is a period when the level of business activity slows and gross domestic product [GDP] shrinks until it reaches a trough. Prices are falling and unemployment is rising.
- Trough: This is a low turning point or a local minimum of a business cycle. Unemployment rate is at its highest, and prices are falling.
Newspapers often have headlines such as those that follow which require an understanding of economics. What is the difference between expansion and recession? Which headline would get your attention? Why?
 Headlines
Find a current newspaper headline about the economy which has one of the following terms in it (recession, recovery, depression, growth) - be sure to include a properly formatted citation. Also ask a question that relates to cause and effect or stability and variability.
ACTION
Measuring the Economy
In macroeconomics, economists have determined many approaches to measure economic activities. Gross Domestic Product (GDP) is one method of determining the economic wellbeing of a country. GDP was first developed during the Depression by Simon Kuznets (who later won the Nobel Prize for this work). He shared it with the U.S. Congress, but warned against expecting GDP to answer the most important questions for a country: “The welfare of a nation can scarcely be inferred from a measurement of national income as defined by the GDP.” (Report to the US Congress in 1934)
There are three different approaches to calculating GDP - the Expenditure Approach, the Income Approach and the Value Added Approach. Regardless of the method used, the total should be the same.
Expenditure Approach
You can watch this short video and/or read the summary note. Note: the film uses the term Xn for net exports, but we will use X-M.
- Aggregate (total) expenditure (spending) by everyone can determine how much we earned, including Consumption, Investment, Government Spending and Net Trade (Exports - Imports).
- Consumption (C) - All goods and services produced and sold to households during the year e.g., services - haircuts, Internet, insurance. Goods are divided into durables (e.g., fridge, car) and non-durables (e.g., newspapers, hamburgers).
- Investment (I) - Purchases of goods that are used to produce other goods (machinery, tools, equipment, computers), to produce revenue (+ changes in inventories).
- Government Spending (G) - Everything the government produces (goods or services: e.g., schools, hospitals, airports, roads) and does not include transfer payments (e.g., welfare) or subsidies to businesses
- Net Trade Exports - Imports (X-M)
- Exports (X) - goods or services produced in Canada but sold abroad.
- Imports (M) - goods or services produced abroad but sold in Canada.
GDP = C + I + G + (X - M)
*This is also the formula for aggregate demand (which you will look at in this activity).
Income Approach
All income generated by the production of national product or factor incomes from factors of production.
- Rent (land) (r)
- Wages (labour) (w/s)
- Interest (capital) (i) [includes dividends paid to shareholders]
- Profit (capital) (
 [if profits are not distributed, called retained earnings] - depreciation [wear and tear on equipment and machinery and indirect taxes are included in profits] in order to balance the expenditure approach).
GDP = w + r + i + 
GDP/GNP - A Short History
The Gross Domestic Product (GDP) has been used widely as a measure of economic well being.
The Gross National Product (GNP) is another frequently mentioned measure of economic progress.
The difference between GDP and GNP is the production boundaries used. GDP measures all goods and services produced in the country whether by domestic or foreign companies. It excludes goods and services produced in other countries. GNP measures all production by domestic companies regardless of where in the world that production takes place. Because its boundaries coincide with the boundaries used to measure a country’s population and employment, GDP is more useful for setting domestic policies and evaluating programs. To simplify the discussion in this document, the term GDP will be used throughout this paper to refer to the measure of economic activity, although at times in the past, the actual measure used was GNP.2 Work by the US and UK Treasuries in the 1930s and 1940s was the foundation of NIPA and GDP methodologies. Since then the work has been expanded on by many nations and has been formalized in the System of National Accounts 1993 documentation.3 Marcuss, R.D. and R.E. Kane, U.S. National Income and Product Statistics: Born of the Great Depression and World War II. Bureau of Economic Analysis: Survey of Current Business, 2007: p. 32-46.4 United Nations Monetary and Financial Conference at Bretton Woods. Summary of Agreements. July 22, 1944. World War II Resources 1946 [online] 2008. (http://www.ibiblio.org/pha/policy/1944/440722a.html)5
Source: A Short History of GDP: Moving Towards Better Measures of Human Well-being
Limitations of GDP as a Measure of Wellbeing
1. There is a lot of economic activity that is not included in the calculation of GDP. Some of these omissions include:
- Financial exchanges - goods or services exchanged between family members because it just shifts purchasing power, for example, allowances or financial birthday gifts.
- Second hand purchases - which have previously been included in GDP calculations for the years they were produced.
- Non-market activities -- e.g., housework, unpaid childcare, work of “do it yourselfers.”
- Underground economy - productive transactions that are unreported, and thus left out of GDP. e.g., smuggling of cigarettes when taxes were very high; transactions paid by cash, or barter. (You learned about the underground economy in Unit 2. In 2013, total underground activity was $45.6 billion in Canada or about 2.4% of GDP according to Statistics Canada.)
2. Product Quality
- New goods or services do not measure improvements in quality over time, or products not previously available (such as fax, computers, etc). With little or no increase in price, GDP only measure sales, not quality.
3. Income Distribution
- Per capita GDP refers to GDP divided by the population as though every individual received the same portion of income, but individuals have far different living standards, depending on how income is actually distributed.
4. Leisure
- GDP does not measure or reflect economic well being which comes from decreased work and more leisure time to pursue interests or enjoyment.
5. Environment
- GDP does not differentiate between economic activities which are harmful to the economy e.g., Exxon Valdez destroyed wildlife and the Arctic, but produced huge economic activity in cleaning it up!
GDP/Capita (2016) estimated:
|
Country |
GDP/capita |
Rank |
|---|---|---|
| Luxembourg | $105,829 |
1 |
|
USA |
$57,294 |
8 |
|
Canada |
$42,319 |
19 |
|
Afghanistan |
$562 |
178 |
|
South Sudan |
$210 |
189 |
Despite the limitations of using GDP as a measure of economic health, it continues to be used. There have been challenges to this idea, as you can see from the sources that follow.
 Double Journal Entry
As you explore these viewpoints, record your thoughts in a double journal entry - see the format outlined below. Be sure to note the specific source before you make your notes in the double entry journal; this will help you compare the various sources. See the criteria for this type of note-taking below:
|
From the Text |
From your mind |
|---|---|
|
|
Viewpoints
“
Our Gross National Product…counts air pollution and cigarette advertising, and ambulances to clear our highways of carnage. It counts special locks for our doors and the jails for the people who break them. It counts the destruction of the redwood and the loss of our natural wonder in chaotic sprawl. It counts napalm and counts nuclear warheads and armored cars for the police to fight the riots in our cities…, and the television programs which glorify violence in order to sell toys to our children. Yet the gross national product does not allow for the health of our children, the quality of their education or the joy of their play. It does not include the beauty of our poetry or the strength of our marriages, the intelligence of our public debate or the integrity of our public officials. It measures neither our wit nor our courage, neither our wisdom nor our learning, neither our compassion nor our devotion to our country, it measures everything, in short, except that which makes life worthwhile. And it can tell us everything about America except why we are proud that we are Americans.
~ Robert F. Kennedy, speech at the University of Kansas, March 18, 1968
If you want to view any links in this pdf, right click and select "Open Link in New Tab" to avoid leaving this page. (View the original article.)
If you want to view any links in this pdf, right click and select "Open Link in New Tab" to avoid leaving this page. (View the original article.)
Economic Thought: Muhbab ul Haq
“
The real wealth of a nation is its people. And the purpose of development is to create an enabling environment for people to enjoy long, healthy, and creative lives. This simple but powerful truth is too often forgotten in the pursuit of material and financial wealth. In the last analysis, human security means a child who did not die, a disease that did not spread, an ethnic tension that did not explode, a dissident who was not silenced, a human spirit that was not crushed.
~ Mahbub ul Haq
 Economic Thought
As you have learned, there are other models that can be used to measure economic growth or well being. As you explore some of the alternative indicators, consider the following questions. You will use one of them to focus a pitch as to which indicator should be used. Record your pitch.
Select one of the following as your focus:
- What are the implications of what ‘counts’ and does ‘not count’ in GDP?
- What is the significance of counting paid domestic work but not unpaid housework, or of not counting volunteer work, in GDP?
- In what ways do alternative economic measures attempt to address shortcomings of traditional economic indicators?
- Which do you think are more useful or realistic – the traditional or alternative measures? Why?
Consider the following criteria in your pitch:
|
|
Checklist Items |
|---|---|
|
|
clear introduction |
|
|
2-3 arguments with evidence/data |
|
|
clarity of voice |
|
|
remember you are trying to convince your audience your choice is the best! |
1. Human Development Index (HDI)
The Human Development Index (HDI) was developed by the United Nations as a metric to assess the social and economic development levels of countries. Four principal areas of examination are used to rank countries: mean years of schooling, expected years of schooling, life expectency at birth and gross national income per capita. This index makes it possible to follow changes in development levels over time and to compare the development levels of different countries.
HDI has played two key roles in the field of applied development economics:
- as a tool to popularize human development as a new understanding of wellbeing, and
- as an alternative to GDP per capita as a way to measure levels of development for comparison across both countries and time.
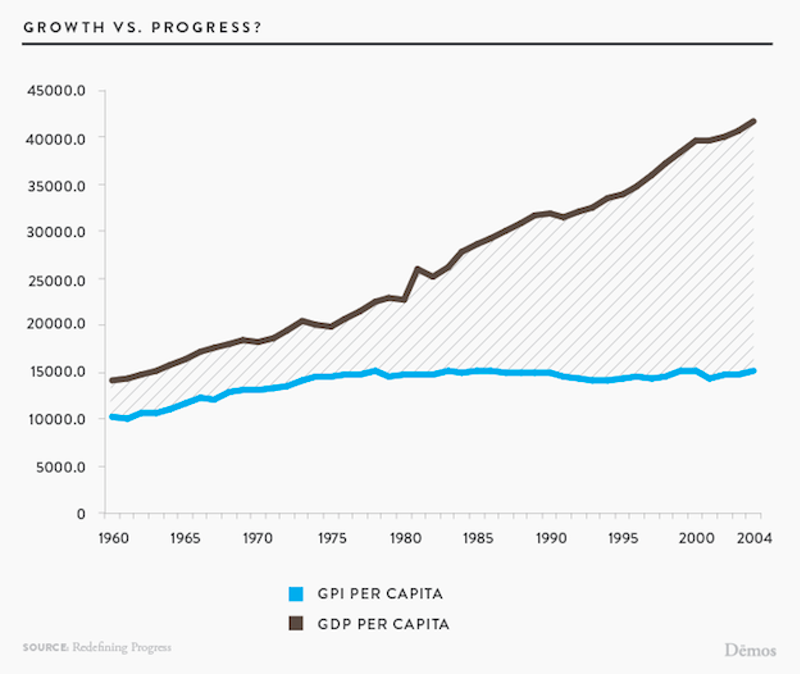
2. Genuine Progress Index (GPI)
The GPI is an indicator of sustainable development and wellbeing; it includes 26 variables related to economic, social, and environmental progress. Economic indicators include inequality and the cost of unemployment. Environmental indicators include the cost of water pollution, air pollution, climate change, wetlands depletion, forest cover change, and non-renewable energy resources. Social indicators include the value of housework, higher education and volunteer work as well as the cost of commuting and crime.
- Some US states such as Maryland and Vermont use this indicator
3. Feminist Approaches
Another approach to measuring economic wellbeing takes a feminist approach. The ideas of economist Marilyn Waring have influenced this approach.
If you want to view any links in this pdf, right click and select "Open Link in New Tab" to avoid leaving this page. (View the original article.)
4. Happiness Indicators
“
A significant strand of economics research into quality of life seeks to understand the relationship between income and life satisfaction, and thereby to address one of life’s ultimate questions—does money make us happy? The simple question does not, always, lead to straightforward answers and we shall look at some of the relations between life satisfaction, income, age, employment, and the affluence of others that have featured in this field. A natural starting point for this work can be found in the work of Richard Easterlin who showed that throughout a decade of significant GDP growth, average levels of life satisfaction in the US population had remained relatively flat. One can argue that as income is unbounded, and life satisfaction was reasonably close to the top of the measurement scale at the start of the period, the result was not that surprising but it helps to raise questions about the reasons for pursuing income growth. If asked, most people would say they would be better off if their income were increased and yet—in terms of our experience of life—it seems it doesn’t actually push the needle over the long term.
~ Paul Anand (is an economist involved in helping governmental organizations move beyond GDP. )
If you want to view any links in this pdf, right click and select "Open Link in New Tab" to avoid leaving this page. (View the original article.)
If you want to view any links in this pdf, right click and select "Open Link in New Tab" to avoid leaving this page. (View the original article.)
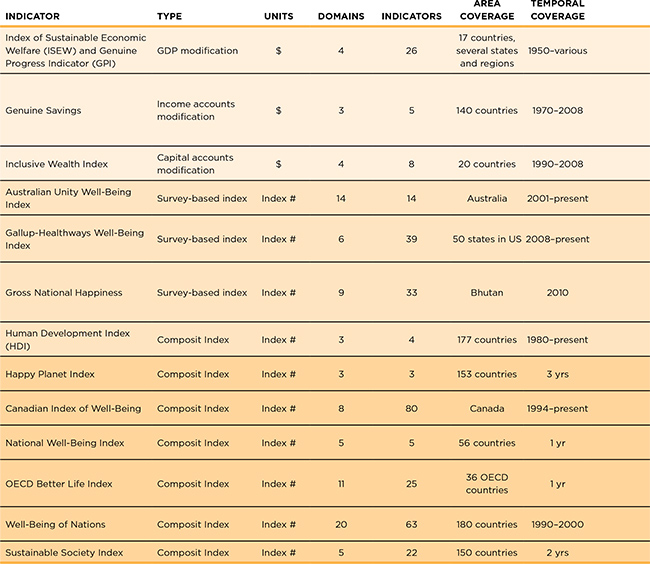
There are many different indicators that can be used to measure economic growth and wellbeing. The Infographic that follows provides a summary.
Other Economic Indicators
When we looked at the business cycle, the factors that determined where the economy was in the cycle included references to prices and unemployment. How these factors are measured depends on other indices that we will investigate.
Unemployment
If you want to view any links in this pdf, right click and select "Open Link in New Tab" to avoid leaving this page. (View the original article.)
If you want to view any links in this pdf, right click and select "Open Link in New Tab" to avoid leaving this page. (View the original article.)

If you want to view any links in this pdf, right click and select "Open Link in New Tab" to avoid leaving this page. (View the original article.)
Unemployment Introduction
Brainstorm questions about unemployment. Use economic thinking concepts to help you.
Unemployment Rate vs Participation Rate
|
Unemployment Rate (U) |
Participation Rate (PR) |
|---|---|
|
|
|

One factor that influences both the participation rate and the unemployment rate is that of discouraged workers.There are several different reasons for this issue:
- Those who say they would like to work, but have given up because they don’t believe jobs are available.
- Not counted as unemployed.
- Reasons include: belief age is barrier (too young or too old), perceived discrimination, lack of required skills.
- More likely to be older, poorly educated, female, living in economically-depressed regions.
 Practice
Using the formulas for Unemployment rate and participation rate, calculate the following and check your answers. Hint - you need to calculate the number of unemployed before you can calculate the rates.
|
Year |
Population
|
Civilian Labour Force
|
Employed
|
Unemployed
|
Participation Rate
|
|---|---|---|---|---|---|
|
1970 |
21,182 |
8,395 |
7,919 |
? |
? |
|
1981 |
24,221 |
11,830 |
10,933 |
? |
? |
|
1984 |
24,978 |
12,282 |
10,932 |
? |
? |
|
1991 |
21,533 |
14,336 |
12,857 |
? |
? |
|
2001 |
24,419 |
16,094 |
14,932 |
? |
? |
|
2009 |
27,202 |
18,250 |
16,727 |
? |
? |
|
2016 |
29,587 |
19,440 |
18,079 |
? |
? |
Solution
|
Year |
Population
|
Civilian Labour Force
|
Employed
|
Unemployed
|
Participation Rate
|
|---|---|---|---|---|---|
|
1970 |
21,182 |
8,395 |
7,919 |
5.67 | 57.6 |
|
1981 |
24,221 |
11,830 |
10,933 |
7.58 | 64.7 |
|
1984 |
24,978 |
12,282 |
10,932 |
11 | 63.889 |
|
1991 |
21,533 |
14,336 |
12,857 |
10.3 | 66.6 |
|
2001 |
24,419 |
16,094 |
14,932 |
7.2 | 65.9 |
|
2009 |
27,202 |
18,250 |
16,727 |
8.3 | 67.1 |
|
2016 |
29,587 |
19,440 |
18,079 |
7.0 | 65.7 |
Unemployment Rate and Participation Rate Questions
Using the data above, what questions do you have?
Who is Unemployed?
If you want to view any links in this pdf, right click and select "Open Link in New Tab" to avoid leaving this page. (View the original article.)
Unemployment Statistics
Reflect on the following questions:
What conclusions can you make about the statistics?
What questions do you have?
How does the fact that unemployed workers who stop looking for work are not counted in unemployment rates affect the accuracy of this economic indicator?
Types of Unemployment
There are different types of unemployment.
- Frictional - normal turnover (3 - 4%+ historically)
- Seasonal - limited to season - e.g., ski instructor
- Cyclical/Deficient Demand - decreased demand, (consumers not buying, so less demand for workers).
- Structural - structural changes in economy, (skills, location, disasters, industries/firms not competing with foreign firms).
One of the government’s macroeconomic goals is full-employment. This usually occurs when the official unemployment rate is between 5-7% overall (the cyclical unemployment is at 0%). The number of persons unemployed, when cyclical unemployment is at 0%, is referred to as the natural rate of unemployment.
 Questions
- For each of the following, identify the type of unemployment.
- Frictional
- Seasonal
- Cyclical
- Structural


Types of Unemployment
Write a headline for one of the above sources.
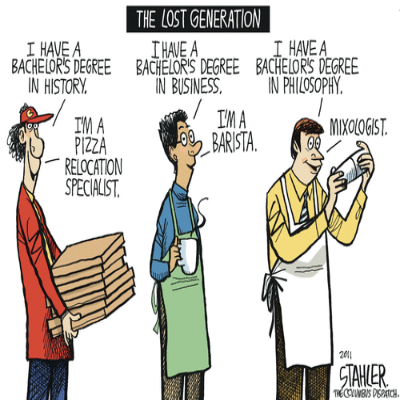
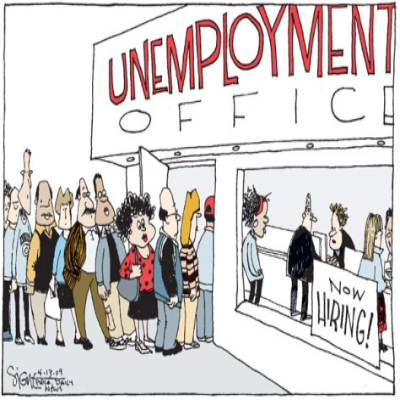
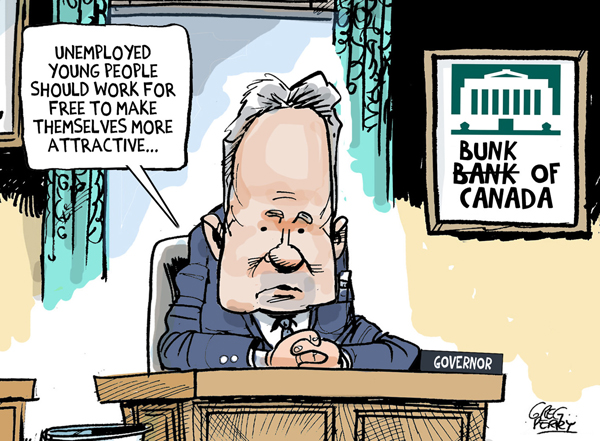
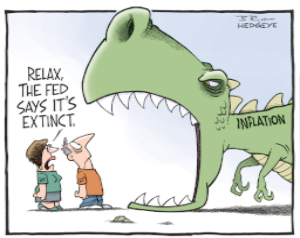
You have seen a number of cartoons in this activity and they are often very useful in providing a quick summary of a specific viewpoint on an issue. But it is important to be aware of the underlying bias and perspective.
Practice
Try practicing your skill at analysing economic cartoons by using this Economic Cartoon Analysis Guide and the cartoon below.
Solution
You can compare your analysis to this Economic Cartoon Analysis Guide exemplar.
Inflation
- An increase in the average general price level, including the prices of the factors of production (land, labour, capital).
- % change in some price index from one year to another.
- Usually measured by Consumer Price Index (CPI).
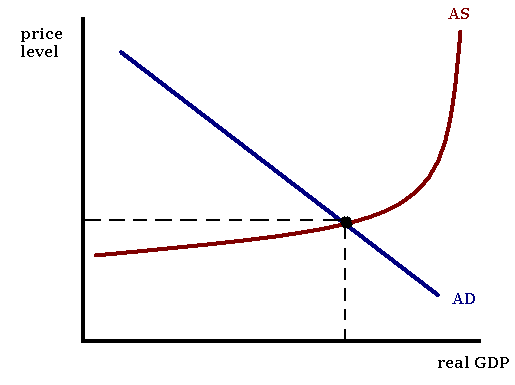
In Unit 1 we explored demand and supply in individual markets (on a microeconomic level). The AD/AS model works on the same principles we learned in Unit 1, but in this case it includes all the goods and services produced within a nation within a given time period (macroeconomic level). See the graph below.
Causes of Inflation
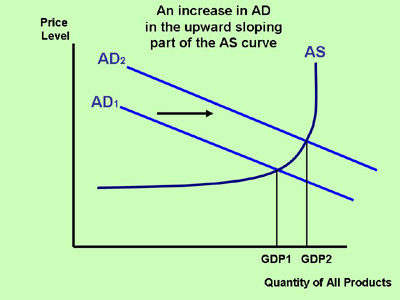
1. Demand Pull
- Increase in aggregate demand (AD) when there is more or less full employment will create excess demand
- Expectations are important - if we expect Prices to ↑, buy now, so ↑D, ↑P ...
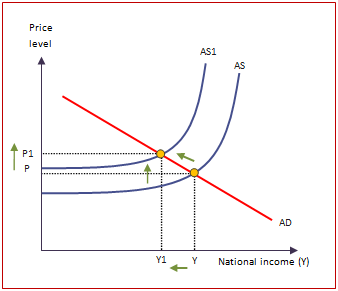
2. Cost Push
- Anything that makes the supply curve ↓ or shift left (e.g. taxes, wages, energy costs, etc.) means ↑ P
3. Imported Cost Push
- If important imports (M) increase, then ↑P at home
- E.g. OPEC ↑P oil, affected importing countries (not at explanation of world inflation, but initiating cause.)
4. Structural
- Occurs because of institutional arrangements in economy
- competition for products or labour does not exist (e.g. doctors, civil servants)
- assumes resources do not move quickly between institutions and easy to ↑ prices/wages (p/w), but not ↓ p/w
- Shortages in expanding industries, (↑ D) on average, ↑ P, (perhaps 0% inflation impossible)
How is Inflation measured?
In Canada the Consumer Price Index is used to measure inflation. It is based on the cost of a basket of goods and services consumed by the “typical Canadian family”.
|
1987 |
Today |
|---|---|
|
1-6 family members |
any size family |
|
income $4,000 - $12,000 |
any income level |
|
urban areas over 30,000 |
urban and rural areas* |
* Excludes those in communal colonies, prison inmates, and chronic care patients in hospitals & nursing homes.
Methodology - the method used to determine changes in prices in Canada is the Consumer Price Index (CPI).

- Use index to compare changes in price from one year to another.
- Most countries use CPI.
- CPI - weighted average of prices of a representation “basket” of goods/services.
- Each component is weighted.
- Stats Can publishes monthly CPI.
Consumer Price Index (CPI)
Calculate the following, using the formula for P.
Canadian CPI Basket of Goods and Services
|
Component |
1986 |
1996 |
2005 |
2015 |
|---|---|---|---|---|
|
Food |
18.1 |
17.8 |
16.9 |
16.4 |
|
Shelter |
25.7 |
27.1 |
25.7 |
26.8 |
|
Household Operations |
10.7 |
10.7 |
11.4 |
13.1 |
|
Clothing/Footwear |
8.7 |
6.3 |
5.6 |
6.1 |
|
Transportation |
18.3 |
18.6 |
19.6 |
19.1 |
|
Health/Personal Care |
4.2 |
4.6 |
4.8 |
4.7 |
|
Recreation/Education |
8.6 |
11.3 |
13 |
10.9 |
|
Alcohol/Tobacco |
5.6 |
3.5 |
3.1 |
2.9 |
What changes do you notice over time? What are some possible causes for these changes?
Limitations to CPI
- Sample of population, not individuals (e.g., 10% ↑ in CPI due to higher tobacco prices, but you’re not a smoker).
- Fixed weights - household spending away from high priced items (e,g., housing prices high, people delay purchasing and rent instead which overstates cost of living).
- Changing composition of ‘basket’ over time (e.g., microwaves, cell phones popular today, not 20 years ago) Stats Can surveys twice every 10 years, and revises weights.
- Quality changes not included (computers continue to provide greater speed and memory, etc).
- A great deal of what's in the average Canadian household’s annual shopping cart is NOT in CPI "basket."
- Does not consider substitutes (eg. generic, rather than brand names).
- Inflation can become hyperinflation.
Why Worry? Why should we care about inflation?
- Main consequences of inflation is that it redistributes income - some benefit, others lose.
- Who gains? Borrowers.
- Who loses? Lenders, unskilled workers, non-union workers, fixed income earners (pensioners).
Canada’s Inflation Rate
In Canada, the most important categories in the CPI basket are:
- Shelter (27.5 percent of the total weight)
- Transportation (19.3 percent).
- Food accounts for 16.1 percent;
- Household Operations, Furnishings and Equipment for 11.8 percent;
- Recreation, Education and Reading for 11.8 percent;
- Clothing and Footwear for 5.7 percent;
- Health and Personal Care for 5 percent;
- Alcoholic Beverages and Tobacco Products for the remaining 3 percent.
The CPI basket is reviewed every four years on the basis of household surveys. The current weights are based on spending patterns in 2009. This page provides - Canada Inflation Rate - actual values, historical data, forecast, chart, statistics, economic calendar and news. Canada Inflation Rate - actual data, historical chart and calendar of releases - was last updated on August of 2017.
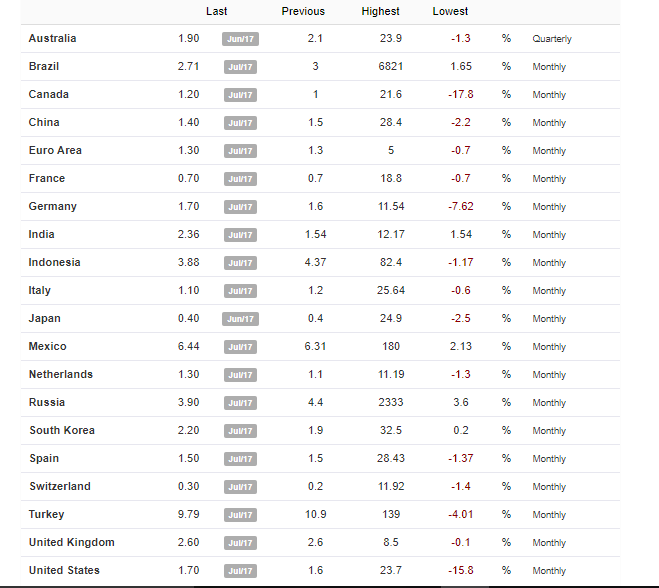
How does Canada compare?
Inflation Rate by G20 Country 2017
GDP, unemployment and inflation are considered the key macroeconomic measures of national well being, despite their flaws. However, what they don’t tell us is how the national income is distributed among the population. This is a key element of well being to consider.
Income Equality Measures
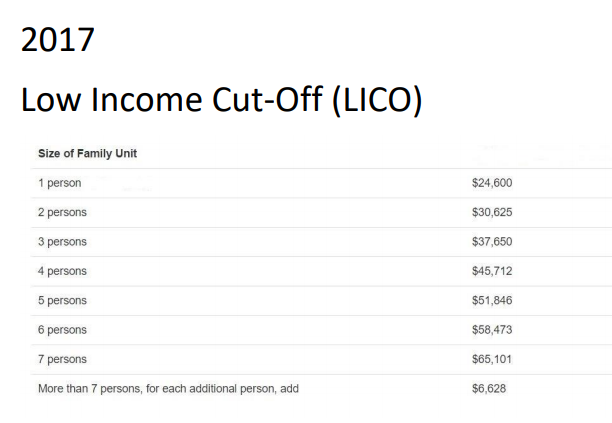
LICO - Low Income Cut-Off is a measure that is defined by Statistics Canada as income thresholds below which a family will likely devote a larger share of its income on the necessities of food, shelter and clothing than the average family. The approach is essentially to estimate an income threshold at which families are expected to spend 20 percentage points more than the average family on food, shelter and clothing. The low income cut-offs (LICOs) were first published in 1967 as part of the 1961 Census monograph series and are by far Statistics Canada's most established and widely recognized approach to estimating low income cut-offs.
Media, researchers and policy-makers interested in measures of low income are typically concerned with the extent to which individuals in the population are living in poverty. Unfortunately, defining poverty is far from straightforward. Media, researchers and policy-makers interested in measures of low income are typically concerned with the extent to which individuals in the population are living in poverty. Unfortunately, defining poverty is far from straightforward.
(All above is from different sections of http://www.statcan.gc.ca/pub/75f0002m/2012002/intro-eng.htm )
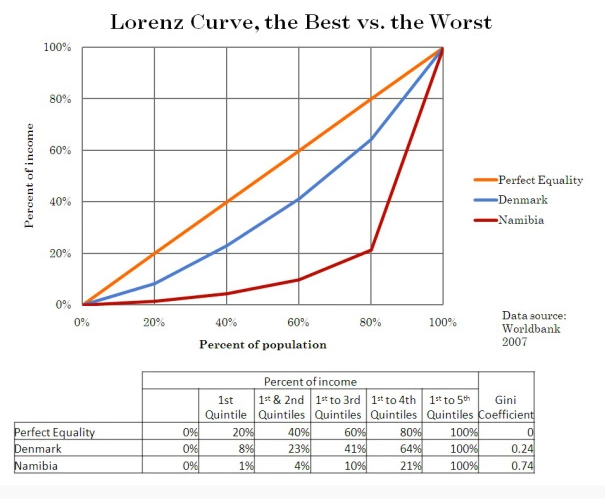
One method of measuring the degree of income inequality is the Lorenz Curve. It is a graph on which the cumulative percentage of total national income (or some other variable) is plotted against the cumulative percentage of the corresponding population (ranked in increasing size of share). The extent to which the curve sags below a straight diagonal line indicates the degree of inequality of distribution. You first determine perfect equality, which is where income is distributed equally to each person (in fact a 45 degree angle). Then you graph each quintile of income and the degree to which it sags beneath the perfect inequality line represents the degree of inequality.
Practice
The following income for Canada in year XX for unattached individuals. Prepare two Lorenz curves on the same graph, before and after income transfers to demonstrate the impact on the same graph.
| Population | Income Share | Cumulative | Income Share With
Income Transfer |
Cumulative | |
|---|---|---|---|---|---|
| Lowest | 20% | 0.1 | 0.1 | 5.8 | 5.8 |
| Second | 20% | 5.3 | 5.4 | 10.5 | 16.3 |
| Third | 20% | 15.5 | 20.9 | 15.8 | 31.6 |
| Fourth | 20% | 27.6 | 48.5 | 24.7 | 56.3 |
| Fifth | 20% | 51.3 | 99.8 | 43.3 | 99.6 |
Inequality and Income Distribution
What are some methods governments can use to change the level of inequality? What impact do government policies have on income distribution?
Measuring Income Inequality
There are other measures for measuring poverty. Check out Low Income Measure (LIM) and Market Based Measure (MBM) and determine which should be used for making economic policy decisions.
Check Your Understanding
Before we end this module, let’s review by watching this quick Mr. Clifford Economics video to check that you understand these concepts and add to your notes.
CONSOLIDATION
Economic Measures
Find a cartoon that refers to one of the economic indicators you have studied that was published within the past 3 months.
Economic Cartoon Analysis
For the cartoon, explain the economic perspective reflected and use the Economic Cartoon Analysis Guide to explain the message.