DESCRIPTION OF INTERACTIVE
This interactive is not suitable for screen readers.Take a screen capture of your created venn diagram. Record your reflections on the following questions:
We also use the notation as the “Union” of the two sets, everything in both sets combined.

For the example of the flu symptoms, it is patients with headache “OR” a cold. It includes people with just a headache, just a cold, and both headache and cold.

We also use the complement. If we wanted to say people in neither A nor B, we would say it as people in the complement of the union of A or B, or .
In the example was given in the question, it was the 12 people that have neither a cold nor a headache.
We can count each of these sets or represent the probability of each of these sets by using our function notation and n and P.
Refer to the table for a summary:
| Symbol | Meaning |
|---|---|
| n(A) or n(B) | Number of elements in A or B |
| P(A) or P(B) | Probability of A or B |
|
|
Intersection of sets: Number of elements or Probability of an element being in both A “and” B |
|
|
Union of sets: Number of items or Probability of an item being in A “or” B |
Consider a game involving red cards and number cards. To compare to Einstein’s quote from the Introduction: What is red is not always a number card, and what is a number card is not always red. We know, just as we hope there is popular and right, there are red number cards.
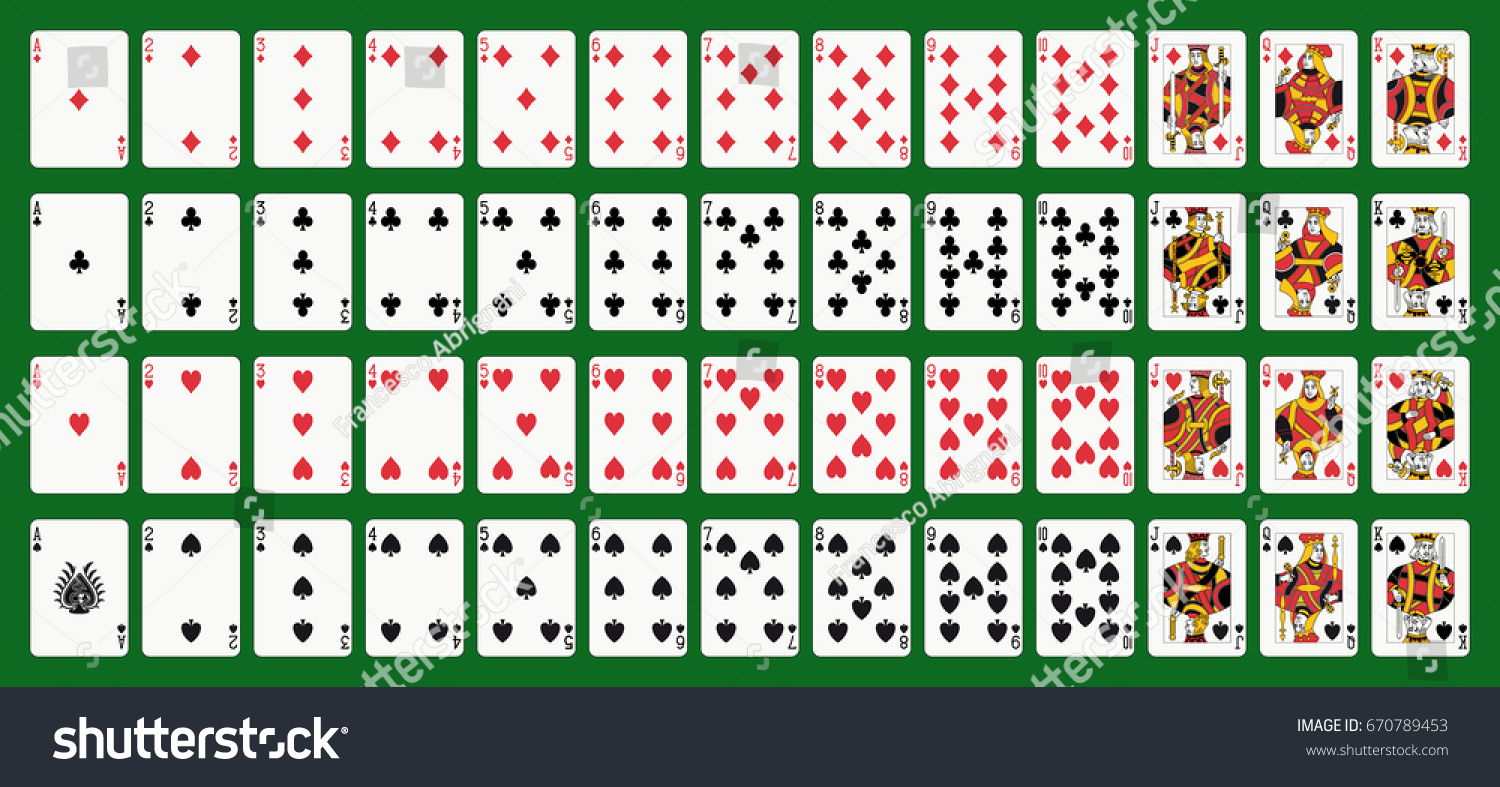
If A is the set of all red cards, and B is the set of all number cards (non face cards, ie. A-10) and S is all cards.
Use the Venn Diagram interactive to draw the Venn Diagram, save with a screen capture, then complete the following table.
DESCRIPTION OF INTERACTIVE
This interactive is not suitable for screen readers.