Discrete Probability Distributions
The Binomial Distribution
MINDS ON
 Consider the Following
There is a 70% chance that an allergy drug will be effective on a person suffering from the allergy symptoms that the drug treats.

What is the probability that, out of 10 random people, it is effective on 7 people. You may try and solve this question from previous knowledge in the course, or give a hypothesis with a justification.
ACTION
In this activity, you will learn about a type of probability that may be the most important and widely used tool. For many questions, there are yes or no answers. Is the drug effective or not? Is the product defective or not? Was the trial a success or a failure?
Bernoulli Trials
When you are finding the probability of a compound event that is made up of the same event multiple times where the probability of the individual trials always stays the same (independent trials) and there are only two possible outcomes, success or failure, we call the trials Bernoulli Trials.
 Example
For example, if we assume that a drug is effective in 70% of the population that requires it, and we take 10 people, each person would be a Bernoulli trial. The "success" is the drug being effective and it will happen 70% of the time. The "failure" is the drug being ineffective, which will happen 30% of the time. The trials almost assume that there are infinite people, and the fact that some have already been effective in the 10 does not affect the drug being effective on the next person. We can calculate the probability of the drug being effective in 7 people with the slot method and multiple cases:
The number of cases can be found by answering a question from Unit 2: How many ways are there to choose 7 people, from the 10 total, for whom the drug will be effective? A similar question would be: How many ways are there to choose 3 people for whom the drug will not be effective?
The answer to that question gives you the number of cases,  , which means, the probability, P(7), equals
  (from the slideshow) added continuously 120 times, or:
This may be surprising. You would expect the drug to be effective for 7 people, since it is effective on 70% of the population. Remember that all outcomes of the distribution have a percentage chance, with all adding to 100%. This outcome, the drug being effective on 7 of the 10, may be the most likely, but it isn't certain. This is an important distinction when considering claims of probability.
The Binomial Distribution Formula
 Record Your Thinking
In a similar manner to the way you calculated the probability that the drug was effective in 7 out of 10 patients, write an expression for P(8), P(9) and P(10). Write an expression for P(x).
In general, the binomial probability distribution formula is:

where X is the random variable for the number of successful trials, x, with a probability of p, out of the total trials, n.
Probability Distribution Table and Bar Graph
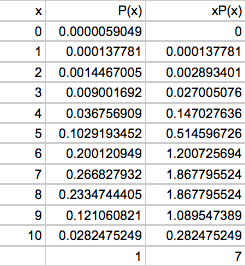
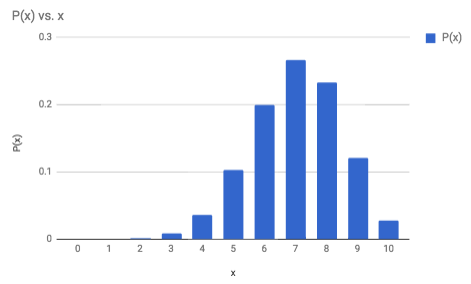
With every probability distribution, you will want to consider what the table of all possible outcomes looks like. From the table, you can create the bar graph and calculate the expected value. Continuing with the allergy drug example, the following table was created in a spreadsheet. A video showing how it was created, without sound, has also been included.
Record Your Work
A spreadsheet becomes valuable here, to make all of these calculations very quickly. Watch the video closely and reproduce this spreadsheet and graph on your own.
The formula used for the probability is "=combin(10,A2)*(0.7)^A2*(0.3)^(10-A2)" where A2 references the x values and changes when you copy and paste the formula (or fill down).
Expected Value
It may not be surprising when you see that the expected value is 7. Remember that the expected value is the average over time. Over time, on average, 7 of every 10 people will find the drug effective. This is consistent with the idea that the drug is effective on 70% of people.
The formula for expected value of a Binomial Distribution is:

where n is the number of Bernoulli Trials and p is the probability of success.
Record Your Work
In August of 2017, a study was released that sampled 100 sausages from across Canada that claimed to have only one type of meat and found that 1 in 5 of them contained meat that was not listed on the package. (Source)
Note: In the second half of the course, you will study what to look for when reading an article to make sure the study is reliable and valid, then you will revisit the article.
You buy 20 sausages from the store. If (definition:This is a big if, as we will see later in the course.) we assume the statistics to be true of your grocery store, that 20% of the sausages contain meat that is not advertised on the label, answer the following:
- Calculate the probability, by hand, of 3 sausages having meat that is not advertised on the label.
- Create a chart in a spreadsheet that shows the probability distribution for the random variable X, the number of sausages that contain meat not advertised on the label.
- Create a bar graph that shows the probability distribution.
- What is the probability that at least 4 sausages have meat that is not advertised on the label? Hint: The indirect method will be a lot quicker here.
- What is the expected number of sausages that have meat not advertised on the label?
Compare your solutions to the solutions below. What did you do differently? What did you miss? What are you having difficulty understanding? Save your solutions and the comparison to Portfolio.
AnswerNotice that we can  as a mathematical way to say the probability of at least 4.
When to use the Binomial Distribution
The binomial distribution is incredibly useful when describing probability situations. However, it can not always be used. Your task will be deciding when it can and can't be used.
Record Your Ideas
Take a moment to describe in your own words what the Binomial Distribution is and when it can be used. Use the Frayer model interactive and take a screen capture of your work. You can sort the situations into categories of "Examples" and "Non-Examples":