Discrete Probability Distributions
The Hypergeometric Distribution
MINDS ON
 Record Your Thoughts
In a class of 25 students, 15 of them have a driver's license. If five students are randomly selected, how could we determine the probability that one of these students has their license? Two of them? What might the formula for the probability distribution look like?

ACTION
Combinations
In the last activity, we saw an entirely new calculation for the Binomial Probability Distribution. In this activity, the calculation should be familiar to you. Like the Binomial Distribution, the Hypergeometric Distribution is used when you are conducting multiple trials. We are also counting the number of "successes" and "failures." The main difference is, the trials are dependent on each other. In unit 2, you saw that combinations are used in dependent trials, when we are taking a smaller group of objects from a larger group and the order doesn't matter. The license question from the Minds On is a good example of combinations, so we will continue with that.
 Example
Continuing with the question from the Minds On...
If you wanted to find out the total number of ways to take 5 people from 25, we could call that n(S) and calculate as: 
The total number of ways that 0 people have a license would be called n(A) if A was the ways to have 0 people with a license: 
so the probability of 0 people having their license is: 
Similarily, the probability of 1 person having their license is: 
Similarily, the probability of 2 people having their license is: 
3 people: 
4 people: 
and 5 people: 
and the results can be calculated and summarized in a probability distribution table and bar graph. Also, just as expected value could be calculated with the other distributions, you can calculate it with this one as well:
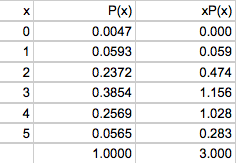
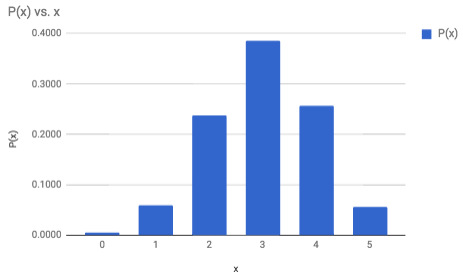
Now, with the table you can answer various different probability questions associated with the number of students that could have their license. You can also state that we expect 3 of the 5 students to have their license.
Record Your Work
As seen in the last activity, a spreadsheet becomes valuable here, to make all of these calculations very quickly. Watch the video closely and reproduce this spreadsheet and graph on your own.
The formula used for the probability is "=(combin(15,A2)*combin(10,5-A2))/combin(25,5)" where A2 references the x values and changes when you copy and paste the formula (or fill down).
The Hypergeometric Formula
From the example with driver's licenses, the formula was:
So, in general we say: 
where:
n represents the total number of objects
r represents the number of objects we are selecting and
a represents the number successful objects
Expected Value
It may not be surprising when you see that the expected value is 3. Remember that the expected value is the average over time. Over time, on average, 15 of every 25 people will have their driver's license.
The formula for expected value of a Hypergeometric Distribution is:
Note: You can think of multiplying the fraction of successes by the total trials, very similar to the Binomial Distributions.
Record Your Work
For comparison, we will go back to the study regarding the meat. In the study, out of the 100 sausages, they found 20 of them did not have the meat that was advertised. (Source)
Out of the 100 sausages from the study, 20 of them are sampled.
- Calculate the probability that 3 of the sausages have meat that is not advertised on the label.
- Create a chart in a spreadsheet that shows the probability distribution for the random variable X, the number of sausages that contain meat not advertised on the label.
- Create a bar graph that shows the probability distribution.
- What is the probability that at least 4 sausages have meat that is not advertised on the label?
- What is the expected number of sausages that have meat not advertised on the label?
Compare your solutions to the solutions below. What did you do differently? What did you miss? What are you having difficulty understanding?
AnswerWhen to use the Hypergeometric Distribution
The hypergeometric distribution is incredibly useful when describing probability situations. However, it can not always be used. Your task will be deciding when it can and can't be used, particularly versus the Binomial Distribution.
Record Your Ideas
Take a moment to describe in your own words what the Hypergeometric Distribution is and when it can be used. Use the Frayer model interactive and take a screen capture of your work. You can sort the situations into categories of "Examples" and "Non-Examples":