Discrete Probability Distributions
Selecting and Applying the Appropriate Distribution
MINDS ON
 Consider the Following
You are conducting a game that uses a standard deck of 52 cards.
Choose one of the following distributions and outline the rules of the game.
- Binomial
- Hypergeometric
- Uniform
You do not have to think about points. What will the player have to do with the cards? What are the outcomes?
ACTION
 Criteria for Distribution Type
Part of the learning goal for this activity is know when to apply each method you have learned for creating a probability distribution. You will need to come up with criteria to look for in situations so that you can choose. Throughout the activity, you can keep coming back to the following question.
What criteria are required when using the following distributions;
- Binomial
- Hypergeometric
- Uniform
Come back to this question as you develop more clarity throughout the lesson and in the discussion.
Example 1
A study reports that 5% of adults are afraid to be home alone at night.

If 20 people are randomly selected, calculate the following:
- The probability that 1 person is afraid to be home alone at night.
- The probability at least 3 of them are afraid to be home alone at night.
- The expected number of people who are afraid to be home alone at night.
Save your work and a comparison (definition:What was the same? What was different? What did you do well? What do you still need to work on?)to the solution found below.
Solution

Example 2
You draw 5 cards from a standard deck of 52 cards.

If X is a random variable that represents the number of hearts you get, calculate the following:
- The probability of 3 or more hearts
- The expected number of hearts. Describe what this number means.
Save your work and a comparison (definition:What was the same? What was different? What did you do well? What do you still need to work on?)to the solution found below.
Solution
Example 3
Out of any 30 car accidents, authorities are analysing the likelihood that different numbers were caused by texting and driving. A study suggests that 1 in 4 accidents are caused by texting and driving.

Calculate the following:
- The probability that 10 or more of the accidents are caused by texting and driving.
- The probability that between 8 and 10, including 8 and 10, accidents are caused by texting and driving.
- The expected number, of the 30 accidents, that are caused by texting and driving.
Save your work and a comparison (definition:What was the same? What was different? What did you do well? What do you still need to work on?)to the solution found below.
SolutionUsing spreadsheet:


Example 4
In the game "Deal or No Deal," players are given the opportunity to pick 1 case out of 26 cases that have different dollar values in them.
During the game, the player must open cases to reveal the amount of money they contain. When the case reveals a prize amount, the player and the "Banker" know that that value is not in the case they selected at the beginning.
In the image, the player has revealed that the selected prize could not be any of the shaded numbers. The prize could be any of the unshaded prizes in either column.

by spilgames
Based on the unshaded prizes in either column, the banker has offered a buyout of $59,639. Should the player take the buyout? Why or why not? Provide work to support your decision.
Save your work and a comparison (definition:What was the same? What was different? What did you do well? What do you still need to work on?)to the solution found below.
Solution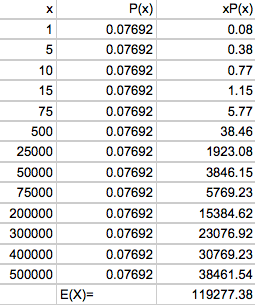
Each probability is 1/13 and the expected value is the average of the outcomes. Note: the Dealer's offer was 59639, exactly half of the expected value).
Example 5
There are 15 females in your class of 25. You form a group of 5 and count the number of females. Calculate the following.
- The probability that 3 or more in the group are not female.
- The expected number of females in the group.
Save your work and a comparison (definition:What was the same? What was different? What did you do well? What do you still need to work on?)to the solution found below.
Solution
Binomial vs. Hypergeometric
In the last two activities, you saw a study regarding sausages having meat that is not advertised on the package.
The same numbers were used, but the situation was slightly different. The Binomial situation (shown on the right below) sampled 20 sausages with the assumption that 20% contained meat not advertised. The Hypergeometric situation sampled 20 sausages from a total of 100 in which a random 20 had meat not advertised. Using similar numbers, the results were very similar as well as you can see below.
 Binomial vs Hypergeometric
- Looking at the Binomial and Hypergeometric situations, list and describe the similarities and differences in the following solutions.
- For each of the situations below, answer the following:
- Referring to your criteria for selecting a probability distribution, what distribution would be used?
- Change the scenario so that the other distribution would be used. For example, if it is Binomial, change to Hypergeometric.
Scenario 1:
Your manager at work is giving away tickets for the local Lacrosse game. She has 10 tickets: 4 in the blue section and 6 in the Green section. She gives you two at random. What is the probability that they are both in the blue section?
Scenario 2:
40% of the music you listen to is by a Canadian artist. If you listen to 10 songs, what is the probability that 5 of them are by Canadian artists?