Organization of Data For Analysis
Introduction to Data
MINDS ON
 Record Your Thoughts
Read the following article from May 2017, 7 Canadian snacks you can't get in the U.S. and the backstory on why from CBC,
If you want to view any links in this pdf, right click and select "Open Link in New Tab" to avoid leaving this page. (View the original article.)
or use the internet to research why ketchup chips are only sold in Canada, not the U.S.?
Now answer the question: how are statistics used to make decisions as to what products companies sell, or don't sell?
ACTION
Primary vs. Secondary Data
Statistics are used to make many of the decisions in life. Often, we refer to secondary data, which is data that is collected, organized and analysed by someone other than ourselves. We, as consumers of the knowledge, need to constantly ask ourselves if we trust the source and question if the source has made sure the data is as valid and reliable as possible.
In the absence of valid and reliable secondary data, we can collect, organize and analyse primary data, which is a study that we conduct on our own. To do this, there are a number of considerations that we need to keep in mind to make sure our own data is valid and reliable.
This unit, and the rest of course, will focus on the collection, organization and analysis of primary and secondary data.
One trusted secondary source that we have in Canada is our government agency, Statistics Canada.
According to their website, "Statistics Canada produces statistics that help Canadians better understand their country - its population, resources, economy, society and culture."
Record Your Findings
- Visit the Spotlight on Canadians section of the Statistics Canada website. Choose one of the titles, from the chart. Read some of the sections of the report and summarize any important findings that you have learned, in your own words.
- Visit the Analytic Products, 2016 Census section of the Statistics Canada website. Choose one of the product names, from the chart. Read some of the sections of the report and summarize any important findings that you have learned, in your own words.
Sampling the Population
On the Stats Canada website, you can find the General Social Survey on Time Use released in June of 2017. In the description of the survey, there is a section called Data Accuracy that states:
"As the data are based on a sample of persons, they are subject to sampling error. That is, estimates based on a sample will vary from sample to sample, and typically they will be different from the results that would have been obtained from a complete census."
This statement discusses some foundational definitions of statistics that you will keep coming back to throughout the remainder of this course.
Definition: A population is a collection of people stated as specifically, in terms of location and demographic traits, as a study desires. The common thought is that population is a number. Now, while it is true that we often put a total number on a population, the more scientific definition is more qualitative. (definition:related to qualities as opposed to quantities)

Consider the example of the population of secondary students. If we said that our population that we would like to study is secondary students, what would that mean? Would secondary students in Nunavut have the same qualities as secondary students in Toronto? This leads us to the "as specifically as a study desires" part of the definition:
Examples of populations:
- All secondary students in the world
- All secondary students in North America
- All secondary students in Canada
- All secondary students in Ontario
- All secondary students in your town
- All secondary students in your school
- All secondary students in grade 12 at your school
If a study could state something that is true for all human beings, it would be a tremendous study. Some things are true for all human beings. We all need food, water, shelter, etc. These are important findings. When studies find that something is true for a broad population they are truly monumental studies. However, it doesn't always make sense for you to define your population as broadly as possible. It may be very difficult for you to generalize a conclusion to the entire population, if the population is very broad. There will be limitations when coming up with a sample.
Definition: As it is very difficult to collect data from everyone in a population, there is a need to sample the population. A sample is a collection of a smaller group of people from the population. Ideally, you would like your sample to represent the population.
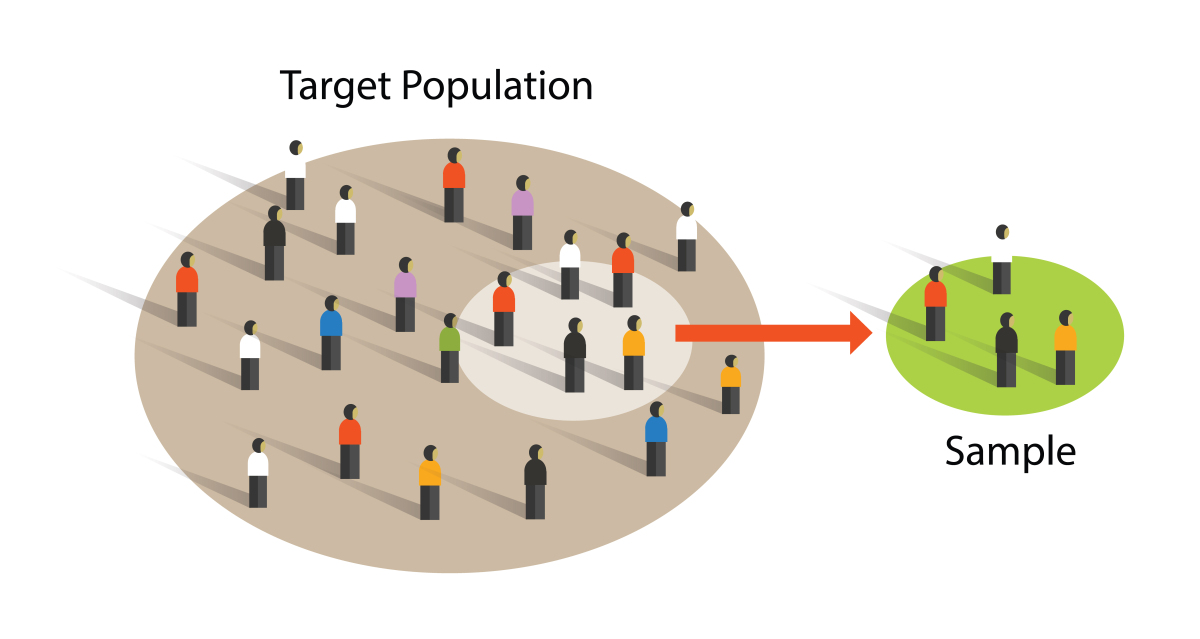
To represent the population, we use what is a called a representative sample. Doing so means that whatever findings are true for the sample should also be true for the entire population.
Variability is Inherent in Data
Although steps are taken by researchers and statisticians to create representative samples, there will always be variability in data collected.
Definition: Variability in statistics is the extent to which samples, data from those samples, and corresponding conclusions are different from study to study. It is a lack of consistency. You can also think of it as something that is caused by bias. You will learn more about bias in later activities.
Reliability and Validity
Two helpful ideas, in order to reduce variability in sampling and conclusions, are validity and reliability. They are foundational concepts of statistics. They are separate ideas, that work together. A conclusion can be valid but not reliable and reliable but not valid. Good studies are both valid and reliable.
Definition: Reliability is the extent to which if a study was done over and over again, it would yield the same results.

Definition: Validity is the extent to which the conclusions represent the population that they claim to represent.

 Consider the Following
In Unit 3, you learned of a study that was released in August of 2017 regarding the number of sausages that contain meat that was not advertised on their label. Read the CBC News Article and consider the questions that need to be asked to determine if the study was valid and reliable. You can ask questions and you can also suggest where the article might give hints that the study was or was not valid or reliable.
If you want to view any links in this pdf, right click and select "Open Link in New Tab" to avoid leaving this page. (View the original article.)
CONSOLIDATION
Application and Communication
Research an example of statistics used in the real world by finding a study that was done in the last 10 years. You can do a general search on the internet, or find studies from well-known news websites. Consider the following questions when you are reviewing sites.
- Is this primary or secondary data?
- What is the conclusion of the statistics?
- What is the population that is impacted by the statistics?
- Is the sample representative?
- What do the findings mean to you and your life?