Continuous Probability Distribution: The Normal Distribution
z-Scores, Percentiles and Probabilities
MINDS ON
 Consider the Following
Assume that the sustained wind speed of a Hurricane is normally distributed.
If it is known that a Hurricane is going to touch down as a Category 4 or 5 Hurricane, we can say, based on past data that there is a 16% chance that the Hurricane will sustain winds of over 273 km/h.

How many standard deviations above the mean is a Hurricane that actually does sustain winds of 273 km/h?
What might the mean and standard deviation be for all Hurricanes classified as 4 or 5?
ACTION
In the previous activity, you learned about the shape of the normal distribution curve and how you can use the numbers 68, 95 and 99.7 to find the probability/percent of data points that are in given intervals based on counting from the mean by standard deviations.
For example, if it is known that Category 4 and 5 Hurricanes have an average of 257 km/h and a standard deviation of 16 km/h, we could draw the following distribution:
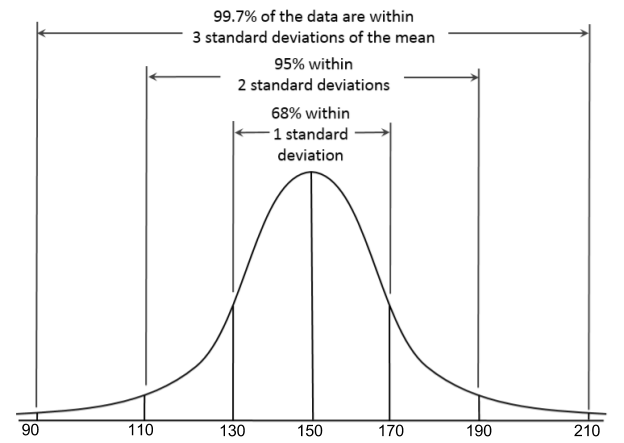
So we could make many claims about the intervals like the one in the Minds On. Notice that we create the intervals by "counting by" the standard deviations. Using the numbers 68, 95, 99.7 will give you a good estimation of many different intervals. We can more precisely calculate any interval using the concept of z-scores.
The z-Score
Definition: A z-score is a measure of the number of standard deviations a given data point is above or below the mean. From the Hurricane example, the values 209, 225, 241, 257, 273, 289 and 305 would have "z-scores" of -3, -2, -1, 0, 1, 2, and 3 respectively.

It is calculated by finding the distance, in terms of standard deviations, that a point is from the average:

where  is a specific value for the normally distributed random variable,
 is the population average
 is the population standard deviation
Also, similarly:

where  is a specific value for the normally distributed random variable,
 is the sample average
 is the sample standard deviation
 Record Your Work
Calculate the following for speeds of Hurricane winds which are approximately normally distributed with a mean of 257 km/h and standard deviation of 16 km/h.
- The z-score for x = 230 km/h.
- The z-score for x = 280 km/h.
- The speed for the z-score of -2.3.
Compare your answers to the solutions below. What did you get correct? What are you having trouble with?
Solution
- z = -1.6875 111111111
- z = 1.4375
- x = 220.2 km/h
Note: to calculate 220.2, we can solve the equation:  by multiplying both sides by 16 and then adding 257:
z-Scores, Percentiles and Probabilities
What has happened by taking the x value and converting it to a z-score is that we are now looking at a different normal curve. This new normal curve is the standard normal curve and has mean of 0 and a standard deviation of 1 and works for any normally distributed scenario:
every other normal curve can use z-scores to make use of the probabilities in this curve.
To determine probabilities of this curve, we use a chart that will help us to find the area under the curve. The chart gives the percentile for a given value for the z-score.
Definition: A percentile is the percentage of data that is below a given value.
You have already calculated some percentiles using 68, 95 and 99.7. For example, you know that the percentile at z = -1 is 0.16 or 16%. In the previous activity we used the fact that 68% of the data was within one standard deviation from the mean, so 16% must be below one standard deviation under and 16% must be above one standard deviation over). This is saying that 16% of the data is below 1 standard deviation under the mean. We also say that the data point for z = -1 is at the "16th percentile."
Similarly, the data point for z = 0 is at the 50th percentile.
Similarly, the data point for z = +1 is at the 84th percentile because 84% of the data is lower than z = +1.
The following chart states percentiles for z = -3.49 to z = 3.49. It gives z to 2 decimal places with the second decimal place across the top requiring you to look across a row to find the precise percentile.
You can watch the following video for a tutorial on how to use the chart:
You can click through the following example for some help with using the table:
Here is an alternative to the chart using the spreadsheet functions: "=normsdist()" and "=normsinv()."
Record Your Work
Determine the following for speeds of hurricane winds which are approximately normally distributed with a mean of 257 km/h and standard deviation of 16 km/h.
- Find the probability that a hurricane measures a speed of less than 230 km/h.
- Find the probability that a hurricane measures a speed of greater than 270 km/h.
- Find the probability that a hurricane measures a speed of between 260 and 280 km/h.
- What would be the speed of a hurricane that has a higher speed than 90% of other hurricanes.
- What would be the speed of a hurricane slower than 75% of other hurricanes.
Compare your answers to the solutions below. What did you get correct? What are you having trouble with?
Solution
- 4.55%
- 20.9%
- 34.98%
- 277.48 km/h
- 246.36 km/h