To Understand is to Perceive Patterns
Pattern Representations
MINDS ON
Download and print the pages U1A2 26 Squares.
Cut out all the squares. You should have 26 squares, starting with a 1 X 1 square up to 26 x 26. When you finish with the squares for this activity, save them for another activity.
Perimeter and Area
Each of the following presents you with a task to complete with your printed squares, as well as a related question. Complete each task and consider the question carefully. When you've generated an answer, check to see if you are correct.
1. Use the square with side length of 12 units. What is the perimeter of the square?
a. 24 units
b. 28 units
c. 48 units
d. 144 units
c. 48 units
P = 4 x side length
P = 4 x 12
P = 48 units
2. Use the square with side length of 12 units. What is the area of the square?
a. 24 units2
b. 28 units2
c. 48 units2
d. 144 units2
d. 144 units2
A = side length x side length
A= s2
A= 12 x 12
A = 144 units2
3. Use the square with the side length of 17 units. What is the perimeter of the square?
a. 34 units
b. 38 units
c. 68 units
d. 289 units
c. 68 units
P = 4 x side length
P = 4 x 17
P = 68 units
4. Use the square with the side length of 17 units. What is the area of the square?
a. 34 units2
b. 38 units2
c. 68 units2
d. 289 units2
d. 289 units2
A = s2
A= 17 x 17
A = 289 units2
5. Consider a square with the side length of 7.5 units. What is the perimeter of the square?
a. 15 units
b. 30 units
c. 56.25 units
d. 19 units
b. 30 units
6. Consider a square with the side length of 7.5 units. What is the area of the square?
a. 15 units2
b. 30 units2
c. 56.25 units2
d. 19 units2
c. 56.25 units2
A = s2
A= 7.5 x 7.5
A = 56.25 units2
7. Consider a square with the side length of 3 1/4 units. What is the perimeter of the square?
a. 10.5 units
b. 13 units
c. 6.5 units
d. 10.5625 units
b. 13 units
Using the fraction
P = 4 x side length
P = 4 x 3 1/4
P = 4 x 13/4
Converting to decimals
P = 4 x side length
P = 4 x 3.25
P = 13 units
8. Consider a square with the side length of 3 1/4 units. What is the area of the square?
a. 10.5 units2
b. 13 units2
c. 6.5 units2
d. 10.5625 units2
d. 10.5625 units2
Using the fraction
A = s2
A= 3 1/4 x 3 1/4
A = 13/4 x 13/4
A = 169/16
A = 10.5625 units2
Using the fraction
A = s2
A= 3.25 x 3.25
A = 10.5625 units2
ACTION
You have been looking at many different patterns along with the various ways to represent the patterns. In the previous activity, you reviewed key features of linear relations that can be identified in each representation. In this activity, you will collect data, create different representations, including algebraic representations, and make connections between the representations.
You will have the opportunity to complete tables of values and graphs using an online graphing tool. The link will open the file where you will input the table of values data. A line/curve of best fit can be drawn, and you will also have the opportunity to fit a line/curve to the data to determine the values for the algebraic representation.
You will also use tiles to make a concrete pattern diagrams of the relation. You can use tiles in your classroom or you can use an online source for geometric shapes or tiles. You can also use grid paper to draw the tiles and add a photo of it into your work.
For the tile diagrams, you can use Exploring Linear Representations or use the mathies Learning Tools - Colour Tiles.
You can learn how to play around with CLIPS - Exploring Linear Representations tool by watching the following video.
 Investigation with Squares
When you have a question to investigate, you should always think about the question and what you might expect to see before you start to collect the data.
Consider:
- How will I label the variables? What quantities are changing?
- Will the values (definition:perimeter and area)
increase or decrease? -
Where might the graph be positioned on the grid? -
Will the relation be linear or non-linear?
-
Write your prediction of the relationship. -
Use the squares to help record the data for the side length and the perimeter. -
Complete the scatter plot. -
If you think a straight line best fits the data, then select Linear Relation. If you think a curve best fits the data (i.e. non-linear relation) then select Quadratic Relation. - Record the algebraic representation from the graphing tool and identify the meaning of the variables x and y for this investigation. Rewrite the equation using the words of this investigation.
- Get an image of your graph and paste it into U1A2 Investigation with Squares.
- Use tiles to create a pictorial model to represent the relation. Take a picture or screenshot and paste it on the page or draw the tiles on the page.
- Write a conclusion about the relationship between side length and the perimeter.
Question 2 - What is the relationship between the side length and the area of the square?
- Write your prediction of the relationship.
- Use the squares to help record the data for the side length and the area.
- Complete the scatter plot.
- If you think a straight line best fits the data, then select Linear Relation. If you think a curve best fits the data (i.e. non-linear relation) then select Quadratic Relation.
- Record the algebraic representation from the graphing tool and identify the meaning of the variables x and y for this investigation. Rewrite the equation using the words of this investigation.
- Take a picture of the screen and paste it into U1A2 Investigation with Squares.
- Use tiles to create a pictorial model to represent the relation. Take a picture and paste it onto the page or draw the tiles on the page.
- Write a conclusion about the relationship between the side length and the area.
Did your predictions match the outcome? Is this what you expected? Why or why not?
Save to your Portfolio.
Collecting Data
You used the squares and kept a record of the side length of each square and the perimeter for the square. Refer to your data in U1A2 Investigation with Squares to verify the data collection.
You probably made a table that looks somewhat like this:

When you set up the table like this, you are stating that the independent variable is the side length and the dependent variable is the perimeter; that is what the columns in the table are understood to mean. As the side length changes, the perimeter changes.
Graph Ready
The values in the table can be viewed as ordered pairs that can be placed on the graph:
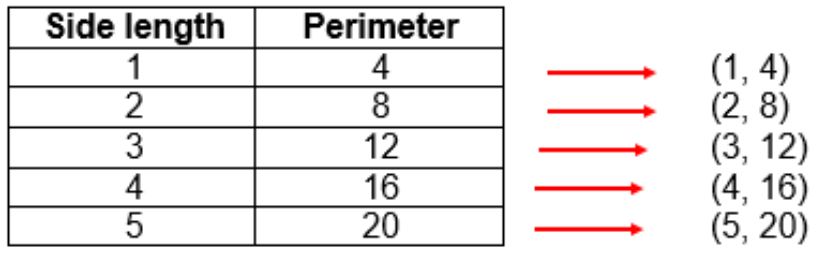
Some people find it easier to see the points for the graph this way while other people prefer to use the numbers directly from the table.
Onto the Graph
The ordered pairs from the investigation are placed on the grid - recall that the horizontal axis is the independent variable and the vertical axis is the dependent variable:
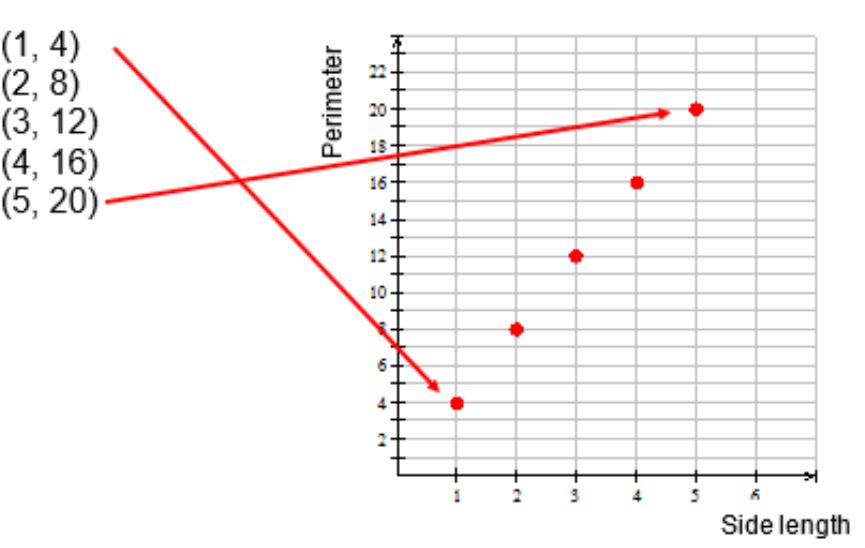
The relation is a linear relation because the graph is a straight line. This line passes through all the points from the table. It also passes through the point (0, 0) or the origin.
In Tiles
The pictorial representation provides another view of the relationship.
![ A visual representation of the relationship showing 4 circles in step 1, 8 circles in step 2 and 12 circles in step 3. [Click and drag to move] ](_images/u1a2image23.JPG)
Each circle represents one unit of the perimeter. You can see the growth of 4 circles as you move to the right. This picture connects with the step increase in the graph and the increase of 4 in the table.
Equations and Words
The equation for a linear relation is useful because you can calculate the output for any input. It isn’t necessary to draw a graph or continue the table.
You can use the graph to help write the equation.
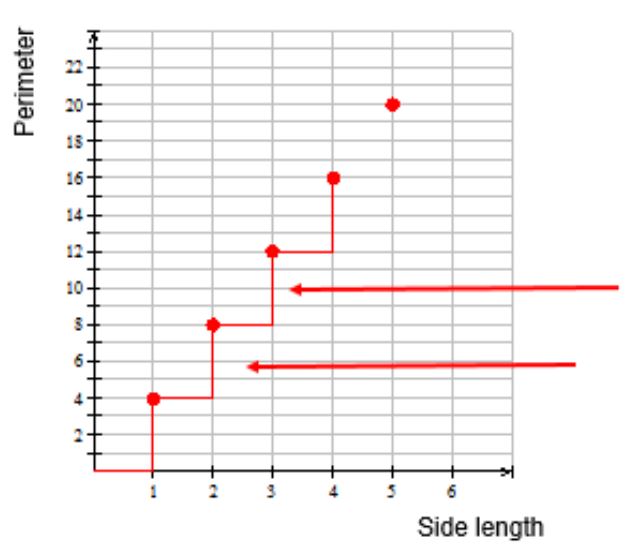
On the graph, there are some steps drawn. Each step rises 4 units and moves over 1 unit. Notice that the dependent value can be calculated by multiplying each independent value by 4. You use this information to write an equation.
For this example Perimeter = 4 x side length or P = 4s.
You can describe the relation using words - The perimeter of the square is four times the side length of the square.
Another example
The previous example involved only the multiplier to determine the dependent value; the line on the graph goes through the origin and the tile picture contains only 1 shape.
Some linear relations pass through the vertical axis at a different point or have 2 shapes in the tiles. There is a multiplier and a constant.

What do you notice about the two representations above? What do you notice that is the same? What do you notice is different?
You probably see that the multiplier is the same (x 4) but the second tile group has added a constant amount to each position - there are 3 additional tiles.
The difference in the equations you write will show the difference between the two pictures. The equation for the second picture is
Number of tiles = 4 times the position number plus 3
This example is not likely to be a representation for perimeter.
 Match and Extend
Download and open the U1A2 Match and Extend document.
On each page you are given a representation and asked to choose one of two corresponding representations that matches the original.
Record your choice by highlighting or circling the chosen representation then complete a third representation.
Below the representations, describe the connections that you made between the relationships.
CONSOLIDATION
Multiple Representations Poster
You are going to create two posters that summarize the connections between the different representations of linear relations.
One poster will focus on a linear relation that is increasing and the other will focus on a linear relation that is decreasing.
Choose a linear relation and create all the representations for the relation.
Describe the connections between the representations and how you know that each one represents the same relation.
For the relation that is increasing, you can use CLIPS to create the representations, use materials in your class and paste pictures into the poster or add shots of other online tools.
For the decreasing linear relation you will have to use materials in your class and paste pictures into the poster or add screen captures from other online tools.
Save a copy to your Portfolio.
Congratulations, you have completed Unit 1, Activity 2. You may move on to Unit 1, Activity 3.