To Understand is to Perceive Patterns
Looking at Differences
MINDS ON
What comes to mind when you hear the word ‘difference’ or ‘differences’? It may be a word that you use regularly or hear on television.
 Word Journal
Open your Word Journal. In the first column, write the word “ difference.” In the second column write down some everyday meanings for the word. Do an internet search for the definition of the word “difference.” There are a few meanings for the word.
Choose the definition that is related to mathematics and record it in the third column ‘In math.” Underline the arithmetic operation word in the definition.
Save to your Portfolio.
Open your document U1A5 Vocabulary Sorter. You will be able to complete the last vocabulary words.
ACTION
When data is collected it is often recorded in an organized table. This was how you collected the data in the previous investigations. When experiments are performed, the independent variable is listed in the left column where the values increase by a constant amount. The second column is used to record the dependent values, the values that are measured in the experiment.
Sometimes, it is useful to determine whether the data represents a linear or a non-linear relationship from the table of values. To identify the type of relation from a table of values, you need to verify that the independent values have a constant increase or a constant decrease.
This independent variable increases by 3:

This independent variable decreases by 3:
Only when you have the data organized correctly can you check the dependent values for a pattern. You check for the pattern by subtracting and finding the difference between two consecutive values. Doing this is called “calculating differences”.
You will explore the calculation of differences and how they are used to determine the nature of the relationship.
In this first video, notice how the y-values or dependent variables are subtracted to find the values of the first differences. Note, if the points plot a straight line (have a linear equation), you can also say that the relation is a linear relation.
Calculate the first differences in each table of values to determine if the relation is a linear relation.
Remember to verify that the independent variable has a constant increase or decrease before calculating the differences.
Calculate the first differences in each table of values to determine if the relation is a linear relation. Remember to verify that the independent variable has a constant increase or decrease before calculating the differences.
Calculate the first differences in the following table of values to determine if the relation is linear:
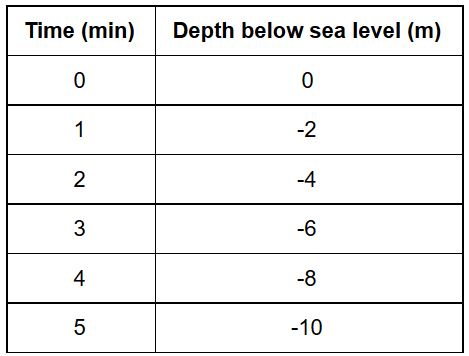
The independent variable (time) increases by 1, so I can calculate the 1st differences. Each subtraction has the answer -2. The differences are constant, so the relation is a linear relation.
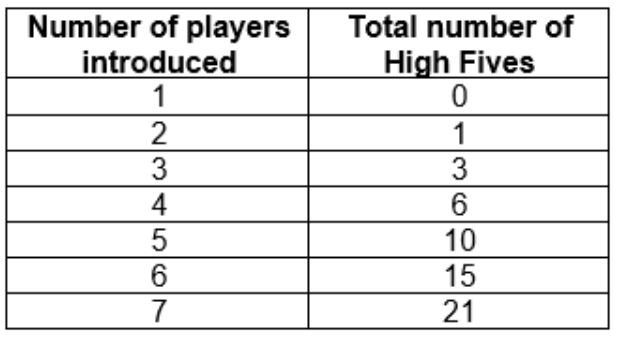
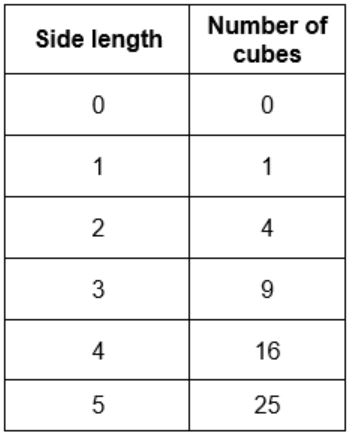
Calculate the first differences in the following table of values to determine if the relation is linear:
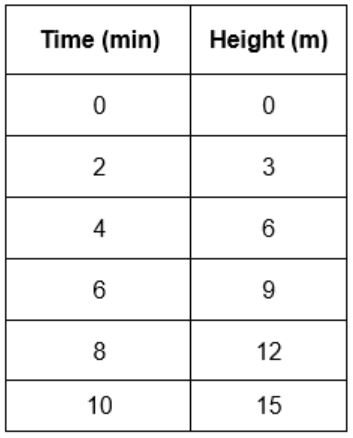
The independent variable (time) increases by 2, so I can calculate the 1st differences. Each subtraction has the answer 3. The differences are a constant value, so the relation is a linear relation.
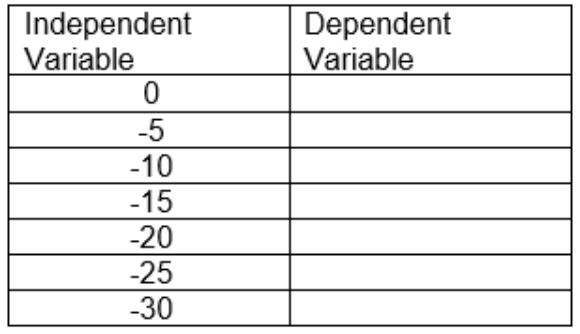
Calculate the first differences in the following table of values to determine if the relation is linear:
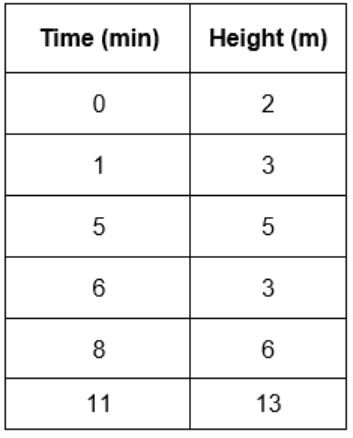
The independent variable does not have a constant increase so I cannot calculate the differences. There is an increase of 1, followed by an increase of 4.
The independent variable increases by 1 so I can calculate the 1st differences. Each subtraction gives a different value so the relation is not a linear relation.
In this second video, notice how the instructor looks at the constant increase in the independent variable (x) before calculating the 1st differences. The instructor does not write down the subtraction of the dependent values. He continues with a second differences column when the first differences are not constant. When the second differences are constant, the conclusion can be made that the relationship is a quadratic relation (a relation where the independent value is multiplied by itself or squared) it is one of the many non-linear relations.
Calculate the first and/or second differences in each table of values to determine the type of relation - linear, quadratic, or neither. Verify that the independent variable has a constant increase or decrease before calculating the differences.
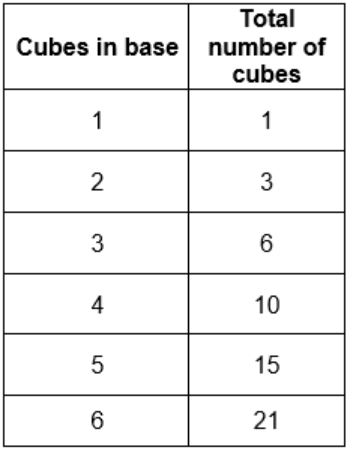
The independent variable increases by a constant amount of 1 so I can calculate the differences. The first differences are not constant so the 2nd differences are calculated. The second differences have a constant value of 2 so the relation is the non-linear relation, a quadratic relation.
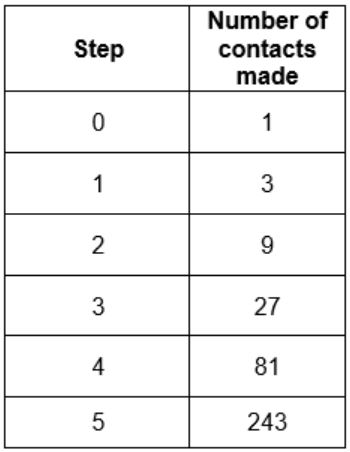
The independent variable increases by a constant amount of 1 so I can calculate the differences. The first differences are not constant so the 2nd differences are calculated. The second differences have a constant value of 1 so the relation is the non-linear relation, a quadratic relation.
The independent variable increases by a constant amount of 1 so I can calculate the differences. The first differences are not constant so the 2nd differences are calculated. The second differences do not have a constant value so the relation is neither linear nor quadratic.
Connecting 1st Differences on the Graph
You use a table of values to create the graphical representation of the relation, and you use the same table of values to determine first differences. Think about where you might see 1st differences on the graph.
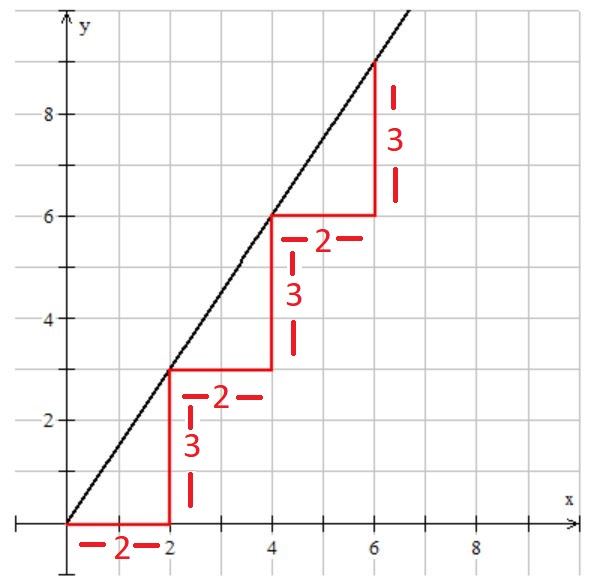
This is the table of values of a linear relation including the first differences.
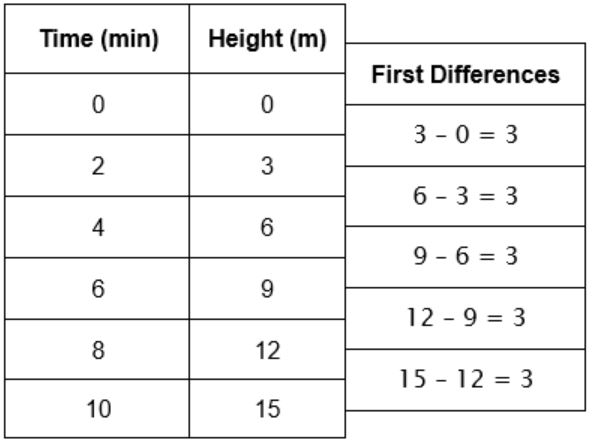
On the graph, follow the red lines starting at (0, 0). Move right the constant increase of the independent variable and then move up to the line - you have increased 3 - the value of the first difference. Repeat this motion as you move right.
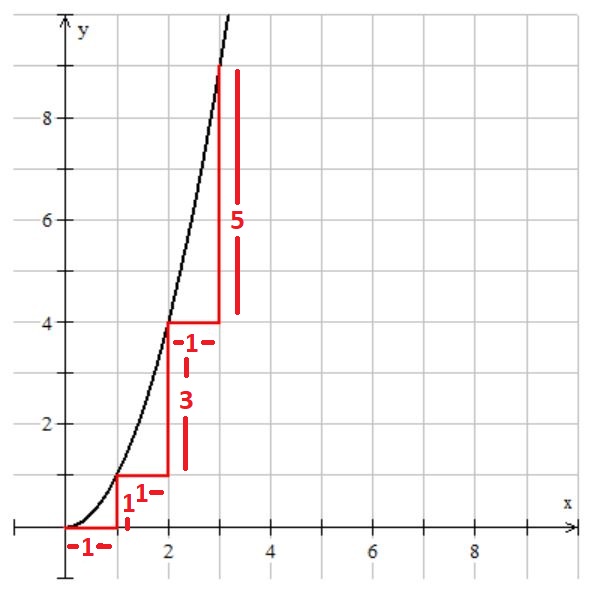
This is the table of values of a quadratic relation including the first differences.

On the graph, follow the red lines starting at (0, 0). Move right 1, the constant increase of the independent variable and then move up to the line - you have increased the 1 - the value of the first difference. Move right 1 unit again, and this time you go up 3 to get to the curve. Repeat this motion moving right and you will see that you trace out the first differences.
 Thinking About the Relations
In this unit, some mathematical concepts were reviewed and some have been extended. The focus has been on using words, numbers and pictures, not algebra, to explore and understand the world of relationships. Revisit the learning goals for the unit.
Reflect on the information that you knew and the information that is new to you.
Write four statements that describe your current understanding of linear and non-linear relations and their representations using the Learning Goals to guide your discussion.
Some sentence starters are:
- I noticed that ...
- I have a question about …
- A pattern I saw was…
- I learned that …
- Something that really helped me was…
- This reminds me of …
- What is most important is to ...
Enter these four statements in your Portfolio.
CONSOLIDATION
 Vocabulary Sorter
Complete the U1A5 Vocabulary Sorter.
Differences
Download and complete the assignment U1A6 Differences.
Congratulations, you have completed Unit 1, Activity 6.