Distinguishing Patterns by Relationships
Linear Patterns and Vocabulary
MINDS ON
Linear, Quadratic or Other
LinQuadNeither2
 Learning Goals and Success Criteria Self-Assessment
Think about the characteristics that are used to identify and label relations.
Complete the self-assessment before you move on.
ACTION
Characteristics of Linear Relations
You have been looking at the characteristics of relations and using the key features to classify relations into different groups - linear, quadratic or other. When looking at the graphs of relations, you know immediately when it is a linear relation - there is a straight line. But you probably also noticed that not all straight lines are the same - some increase as you move from left to right while others decrease. Lines can be very steep, not very steep, vertical or horizontal. You have also identified the x-intercept and the y-intercept of lines.
You have also looked at other representations of relations (e.g. words, equation, table of values and tile diagrams) and learned to identify whether the relation is linear, quadratic or neither.
For linear relations, the steepness of the line, the direction of the line, and where the line crosses the vertical axis or the horizontal axis are the links between the various representations. You need to be able to identify these features in all representations.
 Word Journal
Open your Word Journal. You are using the journal to track the words that have different meanings in everyday use and mathematics.
- In the first column, write the word “ slope”.
- In the second column write down some everyday meanings for the word.
- Leave the third column empty for now.
Save to your Portfolio.
Defining and Determining Slope
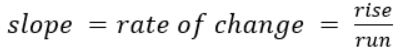
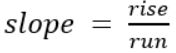
Slope describes the steepness of the line. In a previous course, you probably used rate of change to describe the steepness of a line.
The definition for slope:
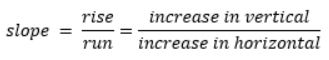
There are many different words or descriptions that mathematicians use to define slope. In the upcoming video, Slope Introduction, you will hear the expressions increase in vertical and increase in horizontal instead of rise and run. We can extend the definition for slope to include the different words.
As the video continues, some new notation is introduced for rise and run. You will hear the expressions change in x and change in y and see it written using the Greek letter delta, Δ to represent the word change. So Δy (change in y) represents the increase or decrease in vertical and Δx (change in x) represents the increase or decrease in horizontal.
Again, we can extend the definition for slope to include the new words.

Although they may look different, each representation has the same meaning.
Watch the video Slope Introduction:
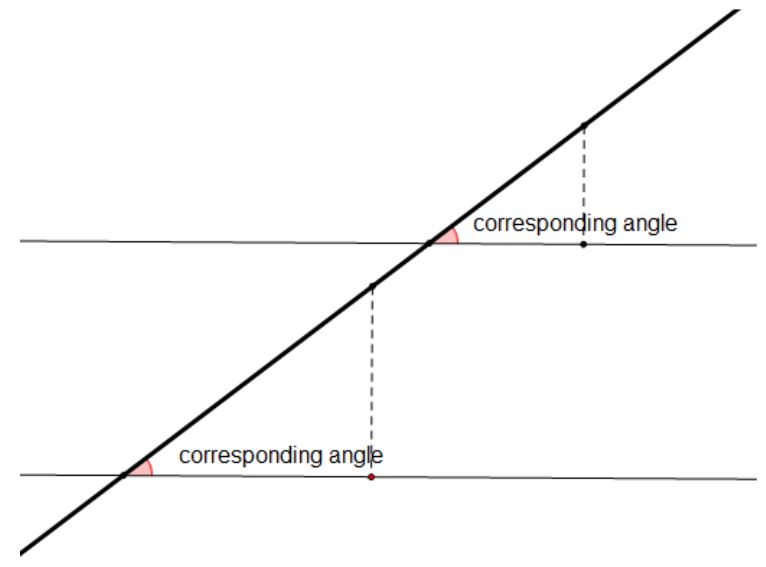
In the video you probably noticed the right triangles that were created using the rise, run and the line. When the ratio of rise:run was written for each triangle drawn along the line, the ratios were equivalent fractions and often simplified to an integer.
Each triangle is similar to any other right triangle connected to the same line. They will all have right angles and the corresponding angles are equal. The corresponding angles are between the line and the horizontal run.
You saw and heard the many different ways to describe slope. In this course you will continue to see and use the following most frequently:
You need to be aware of the alternate descriptions that may arise in other videos and online tools.
In the previous unit, you worked with various representations for the same relation. If every line has a slope, then the slope must be a part of every representation. In the following video, you can see the connection between the value of a slope and where it appears in the other representations.
A line does not always increase as you move from left to right on a grid. Sometimes it decreases. Two lines can have the same steepness but their direction can be different. One can be increasing while the other can be decreasing. The use of positive (+) and negative (-) signs are used to describe the direction of the line on the grid.
Watch the following video that discusses Positive and Negative Slope.
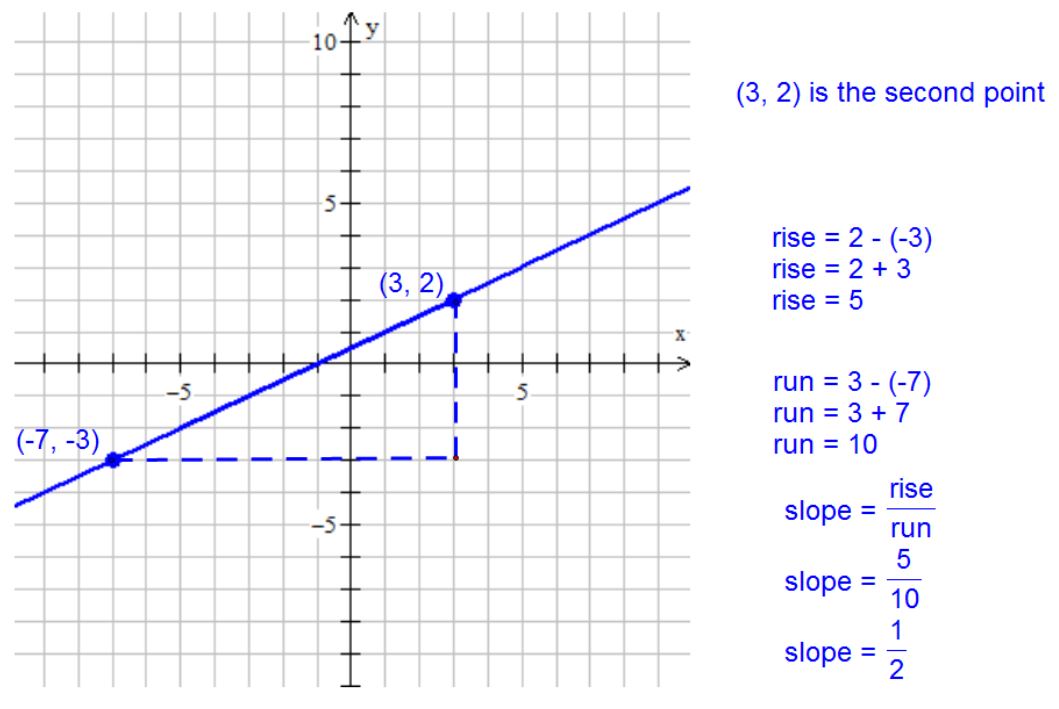
Determine the slope of the blue line on the grid above.
The slope is 1/2. Starting at the point (-7, -3) you can move 2 units horizontally (run) and 1 unit vertically (rise) to return to the line. OR You can start at the point (-7, -3) and move horizontally (run) 10 units and vertically (rise) 5 units to return to the line at the other point (3, 2).
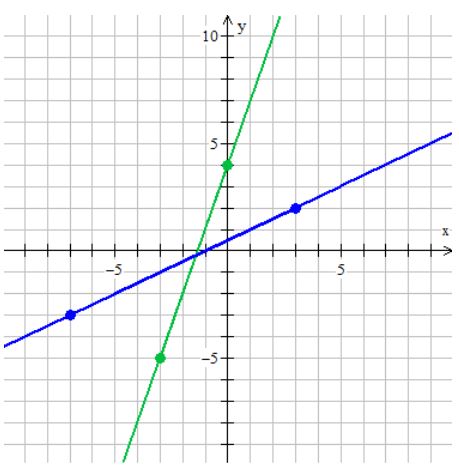
Determine the slope of the green line on the grid above.
The slope is 3. For every run of 1, there is a rise of 3 to return to the line. OR Starting at the point (-3, -5), you can run 3 units and rise 9 units to arrive at the second point identified on the line, (0, 4).
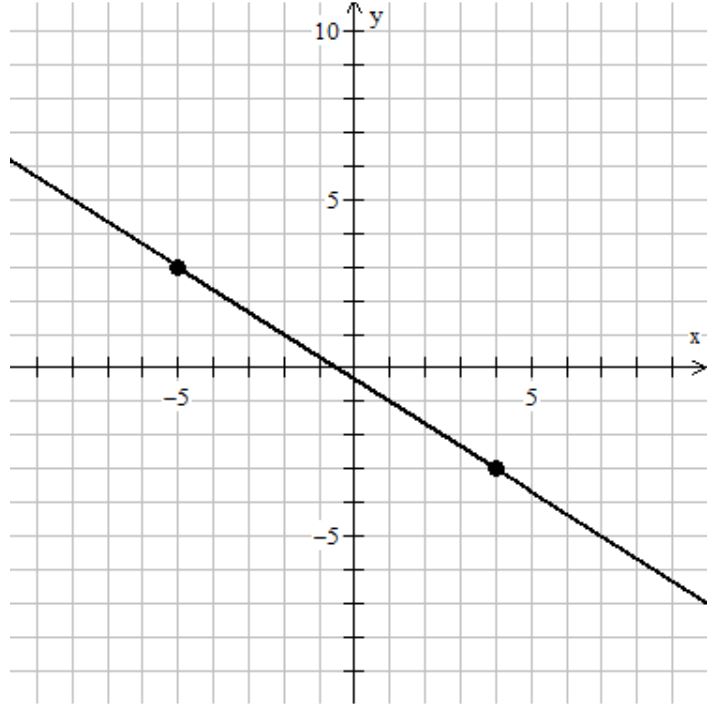
Determine the slope of the line on the grid above.
The slope of the line is -2/3. Starting at the plotted point (-5, 3), you need to move downwards. So the rise is -2 and run is 3 to return to the line. You can also draw a larger triangle. Start at (-5, 3), move down 6 units and then run 9 units to return to the line.

How can you use the ordered pairs to determine the rise and the run for the slope above?
You can draw the triangle using the given points on the line. To determine the rise and the run, you can count distance or you can determine the difference (the value determined by subtraction) between the points, horizontally and vertically.
To determine the run between points, you need to calculate the difference between the x coordinates and to determine the rise, you need to calculate the difference between the y coordinates. When you choose two points, label them as first and second; it doesn’t matter which one you call the first point. When you find the differences, always start with the coordinate values in the second point and subtract the coordinate values in the first.
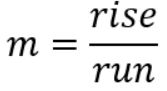
In mathematics, some very important values are assigned special labels. Slope is an important feature of a linear relation and has been assigned the letter ‘m’ as its label. This means that the formula for slope can also be written as:
 Frayer Model - Slope
Download and open the U2A1 Frayer Model Slope document.
In this use of the Frayer Model format, write a definition for the mathematical use of the word slope, record the various ways that you have seen the formulas written, and draw an example of slope on a grid. Finally write down the BIG ideas of slope.
Open U2A1 Frayer Model Sample to see a completed version of this format.
Save this to your Portfolio, adding to the page as you complete this activity.
Slope can be either a positive value or a negative value. You have seen that a line with a slope that is a positive value increases as you move from left to right. A line with a slope that is a negative value decreases as you move from left to right.
The value attached to a slope provides additional information about the appearance of the line on a graph. As you work on the following, think about how you would change the values of the rise and/or run to either make the line steeper or to make the line less steep.
Slopes on a Grid
Open U2A1 Slope to practise determining the value of the slope on a grid.
On each page, there are four grids:
- In the first grid, calculate the slope of the two line segments.
- For the next grids, there are two ordered pairs.
- Plot the two points then draw a straight line through the points.
- Show the rise and the run.
- Calculate the value for the slope
- Summarize your ideas at the bottom of each page.
Save your work in your Portfolio.
In the following resource, you will notice some additional notation when the calculation for rise and run are shown.
The notation, rise = y2 - y1 and run = x2 - x1 uses subscripts (definition:the numbers 1 and 2 written below the line of print) to indicate different x or y values are subtracted to calculate rise and run. You do not need to use the notation in your work.
Check
Check your work by comparing it to the solutions. Keep the completed work in your Portfolio.
You will return to the graphs later in the activity. The language you use to describe the steepness and the value of the slope is very important, especially when you compare one line to another.
Steepness can be a relative term and you may find that you are often comparing the slope value and steepness of one line to the slope value and steepness of another line to determine how steep one is relative to another.
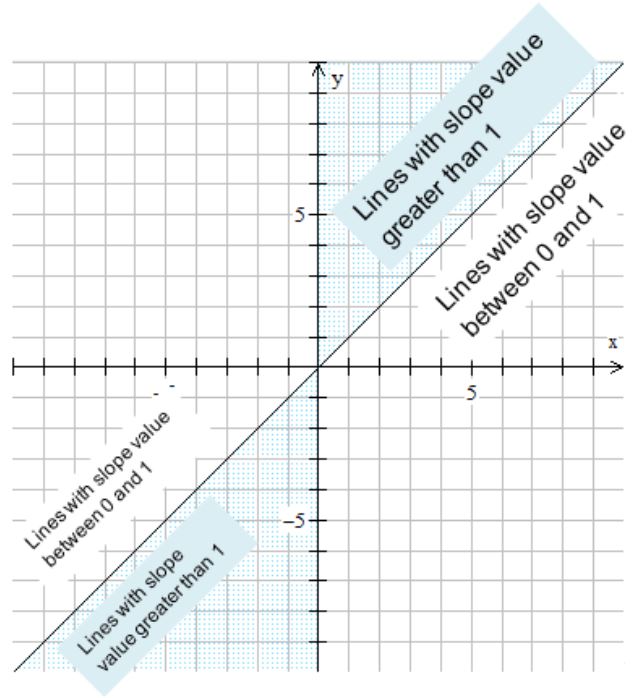
For lines with positive slopes, think about how the steepness of lines with a positive slope will compare to the line with a slope of 1, m = 1.
If the slope is greater than 1, m > 1, (e. g. 4, 3/2, 2.1) then the line is steeper than the line with the slope of 1.
If the slope is less than 1, m<1, (but it is greater than 0 because it has a positive slope) (e.g. 1/2, .75), then the line is less steep than the line with the slope of 1.
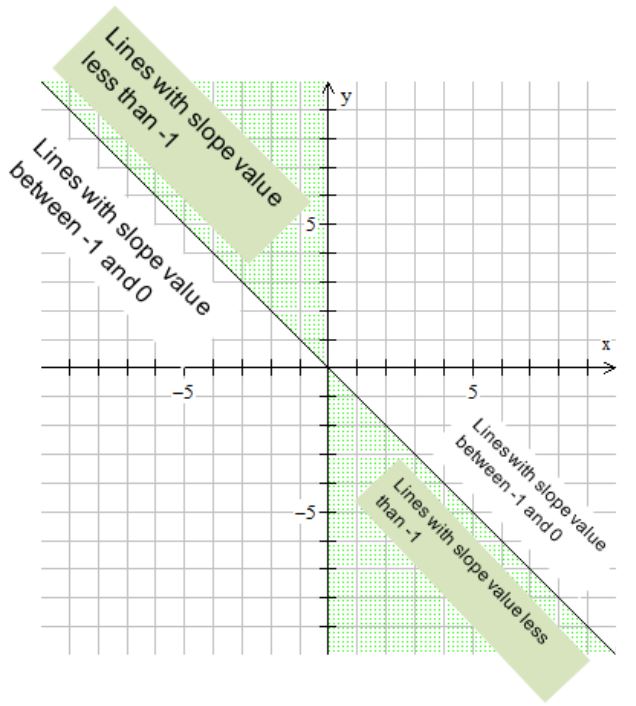
For lines with negative slopes, think about how the steepness of lines with a negative slope will compare to the line with a slope of -1, m = -1.
If the slope is greater than -1, m > -1, but less than 0, (e.g. -1/2, -.75), then the line is less steep than the line with the slope of -1.
If the slope is less than -1, m < -1, (e. g. -4, -3/2, -2.1) then the line is steeper than the line with the slope of -1. The more negative the slope value, the steeper the line.
Crossing the Vertical Axis
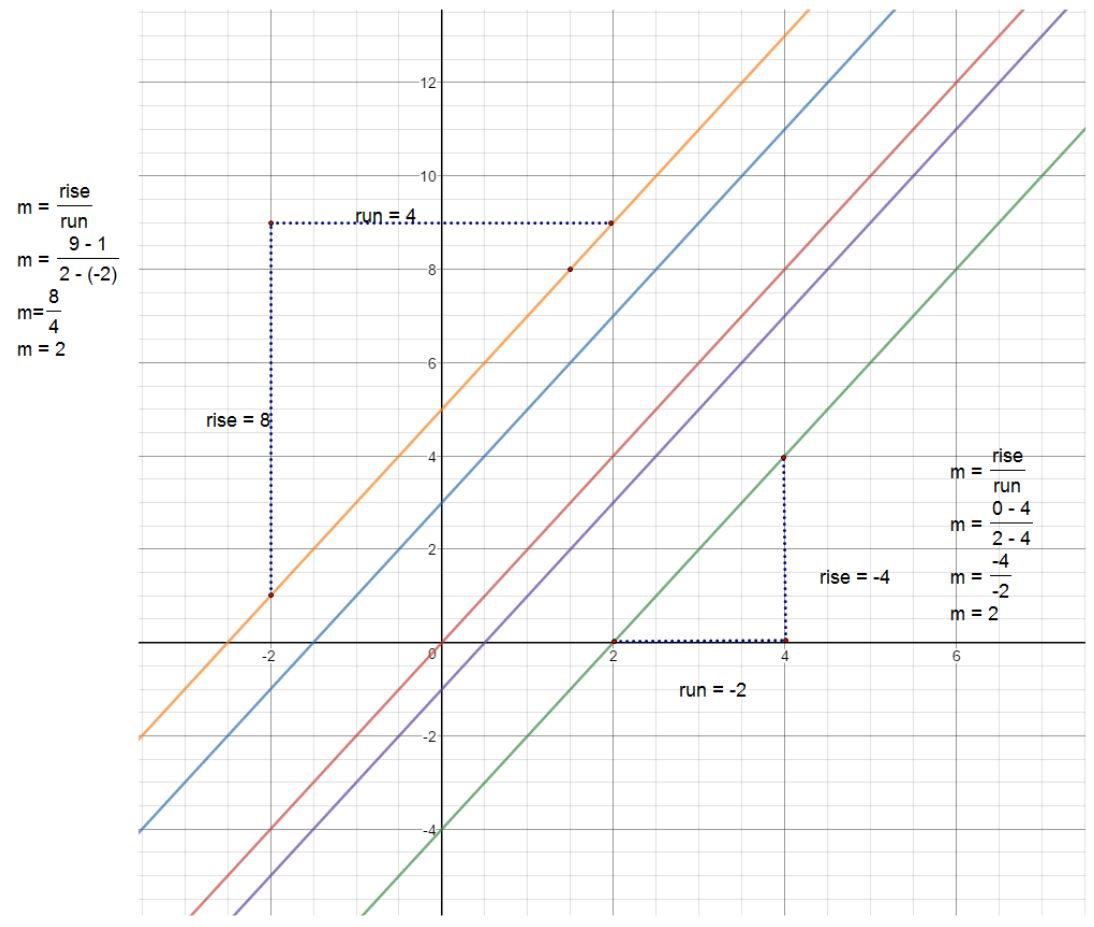
Look at the lines on the graph above. What do you notice is the same and what is different?
The lines have the same slope, slope = 2, but they are in different spots on the graph. The lines are parallel and each line can be seen to cross both the x-axis and the y-axis. If you look specifically at the y-intercept for each line, you can read the y-intercepts from the graph. They are 5, 3, 0, -1 and -4.
The place where a line crosses the y-axis often provides the additional information needed to match representations. The y-intercept is a key feature of a linear relation.
Most lines cross both the x- and y- axes, but it is the y-intercept that you have already found to be useful in matching and creating other representations. What is the value of the x-coordinate for the y-intercept? Think about this as you look at the other representations.
Previously, you connected the value of the slope in the different representations for one relation. Using the same representations, you will now identify the y-intercept.
Learn how to determine the y-intercept in the following video.
Before viewing the video, you were asked what the value of x-coordinate is for the y-intercept? What did you notice?
The x value is always 0. All points on the vertical axis are (0, value of the y-intercept).
Return to your notebook and the U2A1 Slope.
For each line segment, determine the y-intercept of each line segment.
1. The y -intercept is 5 on the red line and on the blue line the y - intercept is 1.
2. The y-intercept is 0.
3. The y-intercept is -2.
4. The y-intercept is 3.
5. The y-intercept is -1 on the blue line and the y - intercept is 6 on the red line.
6. The y-intercept is 0.
7. The y-intercept is -1.
8. The y-intercept is 2.
9. The y-intercept is 5 on the red line and the y-intercept is -4 on the blue line.
10. The y-intercept is 1.
11. There is no y-intercept.
12. There is no y-intercept.
Earlier in the activity, you learned that the slope is assigned a label, the letter ‘m’, because it is an important value for a linear relation. The y-intercept is also an important value for a linear relation and has been assigned a label. The y-intercept has the letter ‘b’ as the label.
Learning Goals and Success Criteria
Review the Learning Goals and Success Criteria.
Download and complete the questions on U2A1 Practice - slope and intercept.
Word Journal
Open your Word Journal in your Portfolio.
Complete the third column for the word slope using information from this activity.
Frayer Model - Slope
Reopen U2A1 Frayer Model Slope.
Add and/or make changes to your definition, formulas and example on a grid.
Complete the BIG ideas of slope.
Save this to your Portfolio. You will continue to access the document during this unit.
CONSOLIDATION
 Frayer Model - Linear Relation
In the previous Unit, you completed U1A1 Frayer Model Linear Relation.
In this activity, you have learned new vocabulary (e.g. slope, rise, run, y-intercept) and skills for linear relations.
Supplement the Frayer Model with the new information.
Reflection Journal
As you progress in the course, you will revisit topics. With each visit to a topic, the detail or complexity will grow. You may notice new ideas or connections and wonder about others. You may be puzzled or have questions about an idea.
To support your learning, you will be keeping a Reflection Journal. Download and open the document Unit 2 Reflection Journal. You will notice that the sentence stems below are at the top of the page.
They can be used to express what you noticed or what you are wondering about. Write at least one noticing or wondering statement for this lesson.
Reflecting on my Noticings and Wonderings:
- I noticed that …
- I am wondering if …
- I am still wondering …
- I have a question about …
- I am still puzzled by …
- A pattern I saw is …
- This reminds me of …
- I learned that …
- Something that really helped me today was…
- What is most important is to …
Congratulations, you have completed Unit 2, Activity 1. You may move on to Unit 2, Activity 2.