Distinguishing Patterns by Relationships
Quadratic Patterns and Vocabulary
MINDS ON
A parabola is the graph of a quadratic relation. All parabolas have the same basic U shape but they don’t all look the same. Like linear relations, parabolas have key features that can vary and these will change how they look as well as their position on a graph.
 Describing Parabolas
Choose one of the four images of a parabola.

Write a description of the parabola on the grid so someone reading your description could redraw it.
How well did your friend follow your description?
Would you need to change any part of your description?
ACTION
The parabolic shape appears in everyday life when we look at things that are affected by gravity. Any projectile (definition:A projectile is an object that is cast, flung, heaved, hurled, pitched, tossed, or thrown (e.g. ball, frisbee, javelin, shot put, etc)) that goes up into the air, slowing as it travels upwards, and then comes down again faster and faster, travels on a parabolic path. Also, reflective surfaces like satellite dishes, lenses and curved mirrors are all parabolic in shape.
Watch the following short video to see parabolas in the world.
 Mathematical Processes
In Unit 1 you completed an activity to learn the Mathematical Processes. You chose two processes to focus on for the remainder of the unit. In this unit, you will continue to work on developing your skills in recognizing when you access the processes as you complete your work. A mathematical process is selected for each activity.
Your recording will begin with this activity. In this activity, the Mathematical Process Representing is the focus. Open your document U2 Mathematical Processes and read the descriptions for the process. As you complete the activity, notice when you are accessing the process and insert your record below the description of the process.
Parabolas and y and y-intercepts
The interactive below will introduce to the idea of x and y-intercepts in parabolas:
parXYInts
The Vertex of a Parabola
The U shape of a parabola is sometimes described as a mountain or a valley.
![An image of a parabola that opens downwards, this is called a mountain. An image of a parabola that opens upwards, this is called a valley.[Click and drag to move] ](_images/u2a2image4a.JPG)
The highest point or the lowest point is called the vertex.

At the vertex, the parabola changes from increasing to decreasing (mountain view) or decreasing to increasing (valley view).
parMtn
parVal
The y-coordinate of the vertex is the maximum or minimum value of the relation.
The following interactive will help you understand the vertex and maximum/minimum values of a relation:
vertex
The U shape of a parabola will either open up or open down.
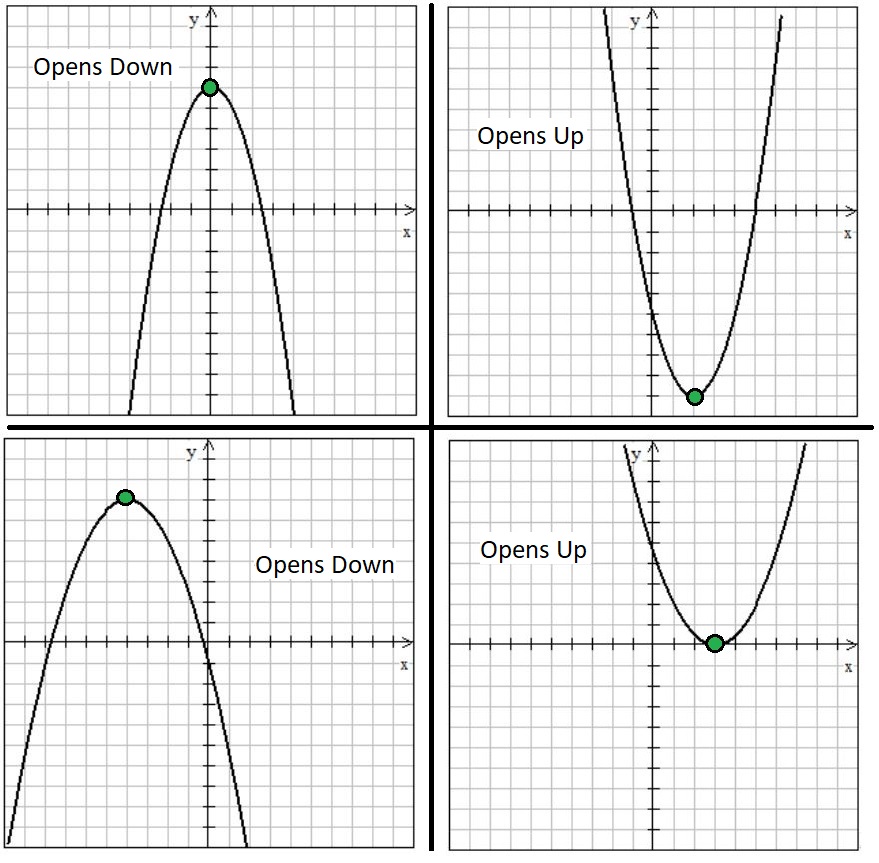
Knowing whether a parabola opens upwards, like a valley, or downwards, like a mountain, provides additional information about the parabola.
A parabola displays reflection symmetry, which is when a line passes through a figure and one half is a reflection or a mirror image of the other.
If a vertical line is drawn through the vertex, then each half of the parabola is a reflection of the other. The vertical line or mirror line is called the axis of symmetry. If you fold a graph of a parabola along the axis of symmetry and through the vertex, the two halves of the parabola will coincide. These two halves of the parabola are sometimes referred to as the arms of the parabola.
If you measure the horizontal distance from the axis of symmetry to the parabola, they will be the same distance.
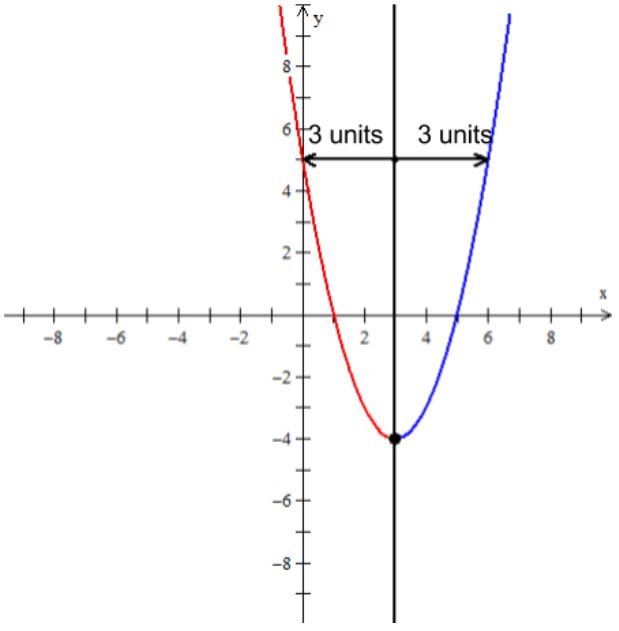
One way that you could describe the location of the axis of symmetry is by stating that the line is vertical and giving the value of its x-intercept. In this image you could say that the axis of symmetry is a vertical line that has an x-intercept of 3.
Describe the axis of symmetry for each parabola. Think about how this information helps to describe and position the parabola on the grid.
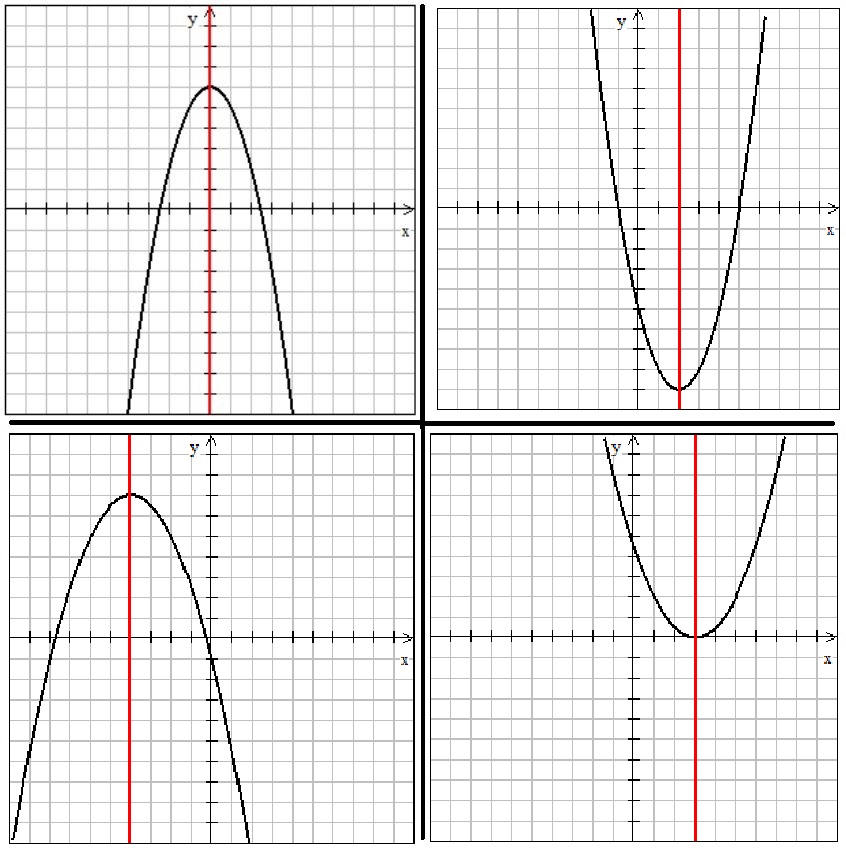
Can you determine which parabola above has an axis of symmetry that has an x-intercept of 0 and is also the y-axis?
Can you determine which parabola above has an axis of symmetry that passes through the point (2, -9)?
Can you determine which parabola above has an axis of symmetry with an approximate x-intercept of -4?
Can you determine which parabola above has an axis of that passes through the point (3, 0)?
The vertex and the axis of symmetry are additional key features of a parabola.
Symmetry in the table of values
A graph is not the only representation of a quadratic relation. Key features of the relation may also be present in the table of values and in the equations for quadratic relations.
You can often find the ordered pairs for the vertex, the x-intercepts, and the y-intercept in the table of values. How would you know from a table of values that an ordered pair represents the location of:
- the y-intercept?
- the x-intercepts?
- the vertex? How would you confirm that the ordered pair is the vertex?
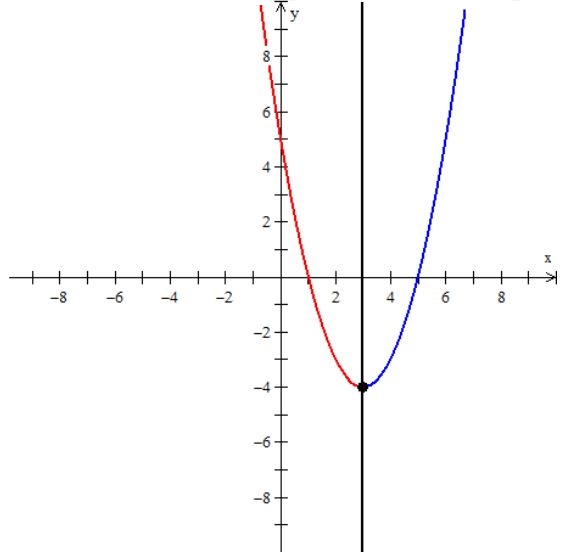
Look at the image below. Here you will see two representations of the same relation.

To read the approximate value from the graph it is important to know the scale that has been used. For this set of graphs, each tick mark is one unit.
Look at the table first and locate the value, -9, in the dependent variable column. That is the lowest value in the column, corresponding to the ordered pair (2, -9).
Locate that point on the graph.
Refer back to the table and look above and below the -9. Notice that both dependent values are -8. On each side of the lowest dependent value, the next value given is greater.
Locate the two points on the graph whose y-value is -8. You will notice one of these points on each side of the vertex and above the vertex. The points are the same distance from the axis of symmetry - they are mirrored in the axis of symmetry.
Repeat with the next set of points in the table of values, (0, -5) and (4, -5). Each point is on one of the arms of the parabola and they mirror each other. The axis of symmetry is halfway between the two points. When you can find the symmetry in the table, you can find the vertex.
In this table, the y-intercept (when x = 0) can be estimated to be -5 (at (0, -5)) and the x-intercepts (when y = 0) can be estimated to be -1 and 5 (at (-1, 0) and (5, 0)).
Look at the table below and identify the vertex. Give reasons for your answer.
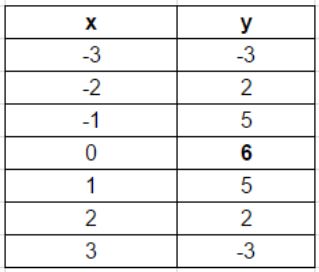
The vertex is (0, 6). The value, 6, is the largest value in the dependent column. Before and after the value 6, the dependent value is 5. This means that the shape increases through the value 5 to the maximum value 6 and then decreases and passes through the value 5.
On a graph, this would show as symmetrical points that are found 1 unit right or 1 unit left of the vertex, (1, 5) and (-1, 5). This illustrates symmetry. We can see the symmetry of the next two ordered pairs, (-2, 2) and (2, 2). In this situation, the vertex and the y-intercept are at the same point.
What are the x-intercepts of the relation?
The x-intercepts cannot be read from the table of values. The values for the dependent variable jump from 2 to -3. We do not see where the y-value is 0. That means that the x-coordinate for one of the zeros is a value between -3 and -2. In a similar way, another x-intercept will be between 2 and 3.
Math Processes
In this activity, the Mathematical Processes Representing was the focus.
Open your document U2 Mathematical Processes and complete your record of when you used the process of representing.
Save to your Portfolio.
CONSOLIDATION
 Describing and Creating Representations
Review the Learning Goals and Success Criteria from Activity 1 and Activity 2.
Open the document U2A2 Assignment. You will be using the new vocabulary to describe representations and to create a representation using key features of a relation.
Frayer Model - Quadratic Relation
Open the document U2A2 Frayer Model Quadratic Relation.
Complete the four areas using description and diagrams. When you have completed your Frayer Model Quadratic Relation save to your Portfolio.
Congratulations, you have completed Unit 2, Activity 2. You may move on to Unit 2, Activity 3.