Distinguishing Patterns by Relationships
Graphing Linear Relations using Key Features
MINDS ON
Linear relations can be described using specific vocabulary that help to locate where the graph is located on the grid. These words include rate of change, slope, x- intercept, and y-intercept. The values associated with the vocabulary can be positive or negative and include integers(definition:An integer is any one of the numbers . . ., -4, -3, -2, -1, 0, +1, +2, +3, +4, . . .), fractions, and decimal numbers.
For each graph, determine the slope, x-intercept, and y-intercept. Note: Since we are reading values from a graph, all values are estimates.
Select the best answer from the choices provided. Check your answer before moving on to the next question.
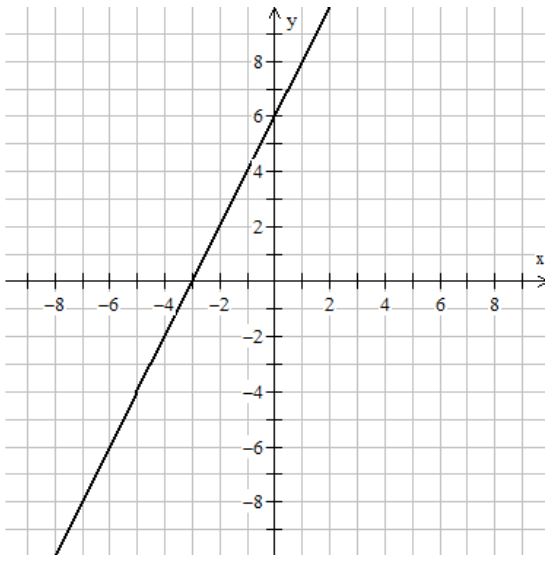
Key features of this linear equation are:
a. slope = 3 and the x-intercept is -3
b. slope = 2 and the y-intercept is 6
c. rate of change = -2 and the x-intercept is -3
d. slope = 2 and the x-intercept is 6
b. slope = 2 and the y-intercept is 6
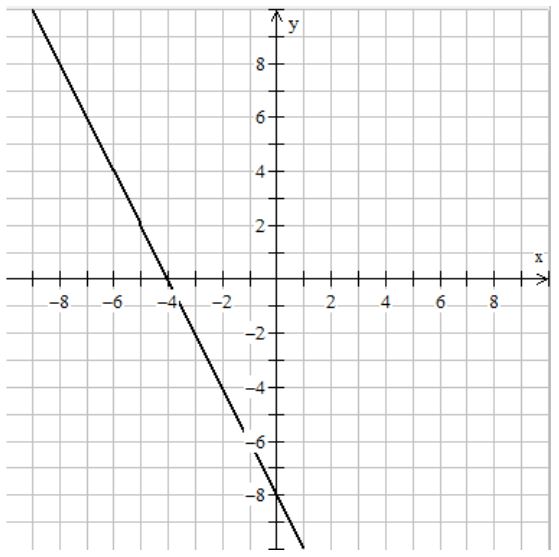
Key features of this linear equation are:
a. x-intercept is 4 and the y-intercept -8
b. x-intercept is -4 and the slope is 2
c. y-intercept is -8 and the rate of change is -2
d. x-intercept is -8 and the y-intercept is -4
c. y-intercept is -8 and the slope is -2
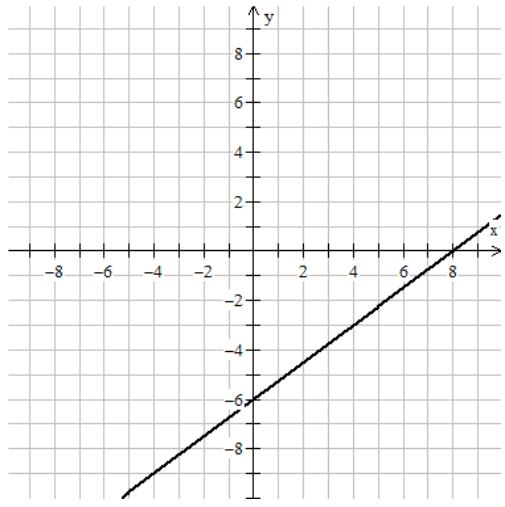
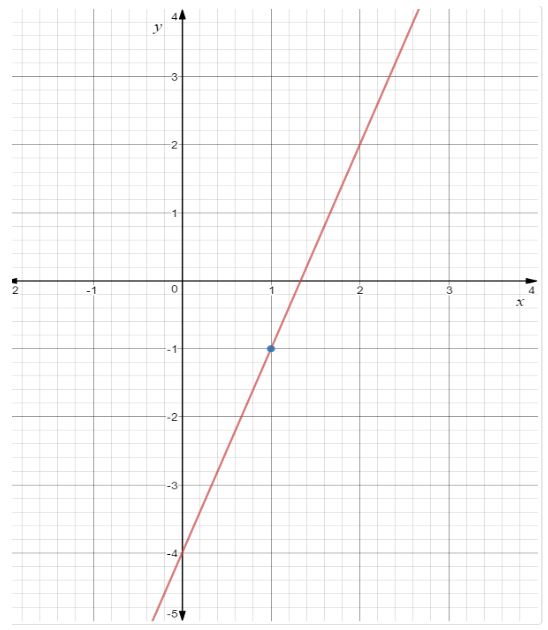
Key features of this linear equation are:
a. x-intercept is 8 and the slope is 4/3
b. y-intercept -8 and the slope is 3/4
c. x-intercept is 8 and the y-intercept 6
d. x-intercept is 8 and the y-intercept -6
d. x-intercept is 8 and the y-intercept -6

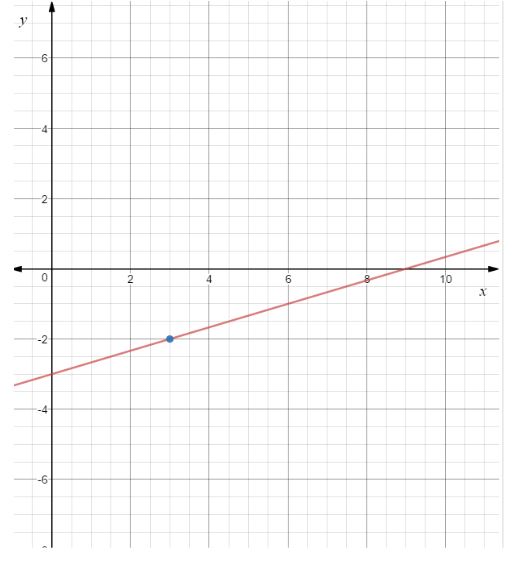
Key features of this linear equation are:
a. x-intercept is 10 and slope is -2
b. x-intercept is 10 and the slope is -1/2
c. y-intercept is 5 and the slope is 1/2
d. y-intercept is 10 and the x-intercept 5
b. x-intercept is 10 and the slope is -1/2
 Learning Goals and Success Criteria Self-Assessment
Complete the following self-assessment related to Learning Goals and Success Criteria before moving on.
ACTION
 Mathematical Processes
In this activity, the Mathematical Processes Connecting is the focus.
Open your document U2 Mathematical Processes and read the descriptions for the process.
As you complete the activity, notice when you are making connections between ideas you already know and the new ones you are learning and insert into your record below the description of the process.
Representing Linear Relations Using Graphing Calculators or Desmos
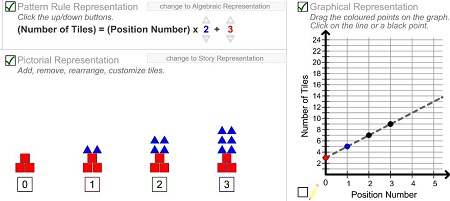
You have been using different representations (e.g., graph, story, blocks, word equation) to display the same relation. In Unit 1, you may have used the Exploring Linear Representations interactive to create the multiple representations for a pattern, similar to the one shown in this picture.
If you did, you probably recall that this tool is limited as it can only be used to create growing patterns and you can show only 1 relation at a time.
You will begin with this tool and use the information to create a graph using either a graphing calculator or desmos, the online graphing tool.
Open Exploring Linear Representations, and click on the Start button.
Your page will show three representations for a linear relation which is different than the relation shown below.
You can see the pattern rule representation, the graphical representation and the pictorial representation for a relation.
You will change your linear relation to the relation shown above.
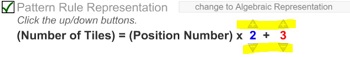
To change the values:
- go to the Pattern Rule Representation
- notice the +/- triangles above and below the numbers (highlighted in yellow)
- use the triangle to adjust the multiplier to read x 2 and the constant to read +3
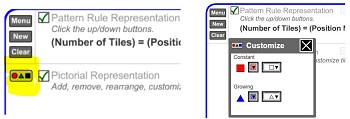
To change the colour:
- go to the Pictorial Representation
- click on the box that contains symbols (highlighted in yellow)
- use the Customize box to change the colour and shape of the tiles for the representation
- the pattern of the tiles is random so your pattern may not look exactly like the pattern above
The pattern rule representation is not a form that is acceptable input for a graphing calculator or desmos. These tools accept algebraic representations (i.e, equations) that are written using the variables x and y. To convert your pattern rule representation to the algebraic representation, click on the box “change to Algebraic Representation” and you now have another representation of the same relation, y = 2x + 3.
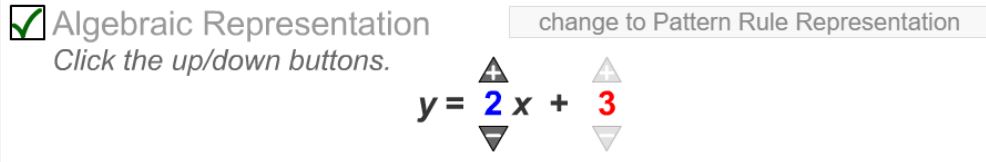
Note that the (Number of Tiles) is replaced with y , the multiplication sign (x) is gone and (Position Number) is replaced with x. To indicate that certain letters are being used as variables, they are italicized, x becomes x and y becomes y.
Graphing with Technology
With either the graphing calculator or desmos, set the values for the x-axis and the y-axis to have the relation appearon screen when it is entered into the equation area of the calculator or desmos. It is common for x begin at -10 and end at 10 and y to start at -10 and ends at 10 ( -10 ≤ [Click and drag to move] x ≤10; -10 ≤y ≤10). Set the axes to these values.
Enter the equation, y = 2x + 3, into the calculator or desmos. It should look like the graph in Exploring Linear Relationships.
It should also look like one of the following, although the colours may be different.
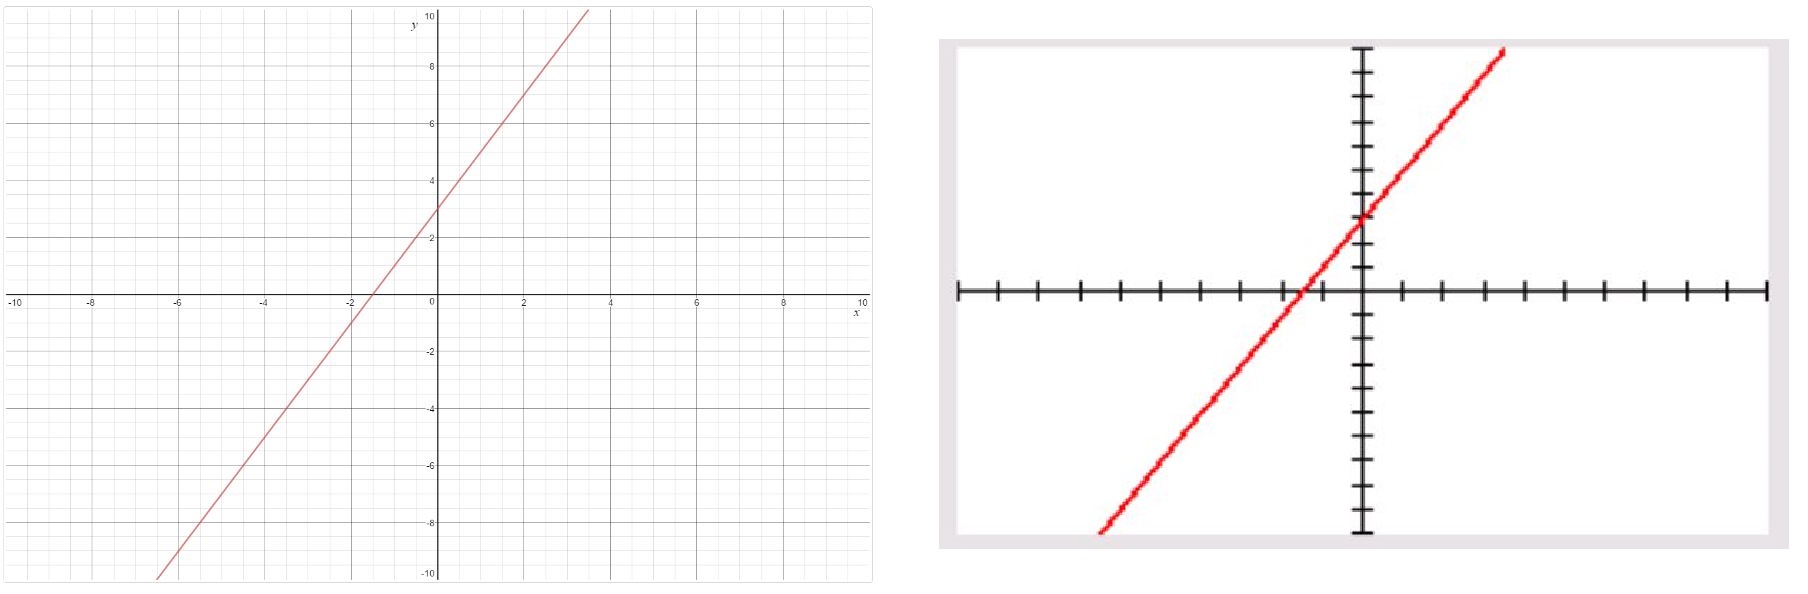
Note that the axes are labelled in desmos with numbers and the variables while in the graphing calculator there are no labels on the graph.
Exploring the Algebraic Equation y = mx + b
In Activity 1, you learned about the key features of a linear relation - slope and y-intercept - and were able to determine the slope and y-intercept values in the different representations. You will be connecting this information to the algebraic representation of a linear relation.
y = mx + b
Look back at your graph and think about where the slope and the y-intercept appear in the equation, y = 2x + 3. Open U2A5 Investigating y = mx + b and record your thoughts about finding the slope and y-intercept in the equation.
Save to your Portfolio.
In Activity 1, you learned about the key features of a linear relation - slope and y-intercept - and were able to determine the slope and y-intercept values in the different representations. You will be connecting this information to the algebraic representation of a linear relation.
Investigation 1
You will verify the position of the slope and y-intercept values in the equation of a linear relation.
Choose one of the five equations in the list on the page. Circle it.
Determine two points (substitute a value for x then solve for y ) on the line. Use the x coordinates: x = -1 and x = 2. You will repeat the steps twice, once with each value of x.
|
Start by writing the equation that you have chosen (e.g. y = 2x + 3) |
y = 2x + 3 |
|
Choose a value for x, here x = -1 |
y = 2(-1) + 3 |
|
Multiply 2 x -1 and write the value -2 |
= -2 + 3 |
|
Add the values together; this is the y when x is -1 |
= 1 |
|
Write the ordered pair. |
(-1, 1) |
Plot the two points on the grid by hand on your paper; draw and extend a line through the points.
Determine the rise and the run between the two points.
Determine the slope of the line and identify the y-intercept.
Identify the position of the values in the algebraic equation.
Where do you notice the slope value of 2 in the equation?
The value 2 is after the equals sign (=) and before the x. It is the coefficient of x, which is the factor by which a variable is multiplied.
Find the value of the y-intercept on the graph. Where do you notice this value in the equation?
The y-intercept is the second term in the equation; it is the term without the variable 'x'.
You practised using the graphing technology by entering the equation y = 2x + 3 and drawing the graph. You will be continuing to use the calculator or desmos to investigate changes in the graph as you change the numbers in the equation. You may need to reset the window for different investigations.
Each tool (calculator or desmos) can graph more than one relation at a time. Reset the window to the following values.( -10  x 10; -4 y 12).
Enter the following equations:
y = 2x + 3
y = 2x + 4
y = 2x + 1
y = 2x - 1
y = 2x
Take a photo or screenshot of your graphs and paste it into U2A5 Investigating y = mx + b. Answer the questions below the screenshot.
Investigation 2
You will repeat the process and verify the position of the slope and y-intercept values using a different equation.
Choose one of the five equations in the list on the page. Circle it.
Determine two points (substitute a value for x then solve for y) on the line. Use the x coordinates: x = -1 and x = 2. You will repeat the steps twice, once with each value of x.
|
Start by writing the equation that you have chosen (e.g. y = -2x + 1) |
y = -2x + 1 |
|
Choose a value for x, here x = -1 |
y = -2(-1) + 3 |
|
Multiply -2 x -1 and write the value 2 |
= 2 + 3 |
|
Add the values together; this is the y when x is -1 |
= 5 |
|
Write the ordered pair. |
(-1, 5) |
Plot the two points on the grid by hand on your paper; draw and extend a line through the points.
Determine the rise and the run between the two points.
Determine the slope of the line and identify the y-intercept.
Identify the position of the values in the algebraic equation.
Where do you notice the slope value of -2 in the equation?
The value -2 is after the equals sign (=) and before the x. It is the coefficient of x, which is the factor by which a variable is multiplied.
Find the value of the y-intercept on the graph. Where do you notice this value in the equation?
The y-intercept is the second term in the equation; it is the term without the variable 'x'.
You will look at a different group of linear equations using a graphing calculator or desmos. Keep the window set at ( -10 x 10; -4 y 12). Enter the following equations:
y = - 2x + 3
y = - 2x + 4
y = - 2x + 1
y = - 2x - 1
y = - 2x
Take a photo or screenshot of your graphs and paste it into you U2A5 Investigating y = mx + b document. Answer the questions below the screenshot.
Recap what you did to graph a line using two points:
- You used the equation of the linear relation to find two points on the line by substituting values for x and solving for y.
- You plotted the points on a grid and determined the slope.
- You noticed the value for slope in the equation.
- Comparing the general equation, y = mx + b with the ones you graphed using technology, you recognize that the slope and ‘m’ are in the same position in the equation.
- You noticed the value of the y-intercept in the equation.
- Comparing the general equation, y = mx + b with the ones you graphed using technology, you recognize that the y-intercept and ‘b’ are are in the same position in the equation.
The general equation, y = mx + b, is similar to the word equations that you used to describe linear relations. The form is more compact, and when ‘m’ and b’’ are replaced with numbers, you can use technology to graph the linear relation.
Check your understanding. For each set of slope and y-intercept values, write the equation and graph it using technology.
slope = 3 and y-intercept = -4
y = 3x - 4; What is it about the blue dot that makes it a helpful point on the line to verify the slope?

slope = -2 and b = 3
y = -2x + 3; What is it about the blue dot that makes it a helpful point on the line to verify the slope?
m = 1/3 and y-intercept = - 3
y = 1/3 x - 3; What is it about the blue dot that makes it a helpful point on the line to verify the slope?
For further study of the slope and y-intercept form of the equation, visit Khan Acadamy's resource.
Vocabulary Sorter
In Unit 1 you completed U1A5 Vocabulary Sorter and saved it in your Portfolio.
Open your document and use what you have learned about slope and the y-intercept to add to the definitions.
Graph a line by hand, using the slope and the y-intercept
You are able to graph linear relations using technology and the general equation. You will be extending your skills of graphing lines by hand using the y-intercept and the slope that you read from the equation.
The interactive below will take you through the steps of drawing the graph of the line defined by the equation, y = 3x - 2:
lineByHand1
 Lines by Hand 1
Use the U2 Grids page to complete the following questions.
For each linear relation, graph the line using the y-intercept and the slope.
- y = ⅔ x - 6
- y = -2x + 7
- y = -4/3x +2
- y = 3 x - 8
Graph a line by hand, using a point on the line and the slope
Sometimes you may not have the y-intercept and the slope for a linear relation. You may have the slope and a point that is on the line but is not the intercept. Think about what you would do differently to graph the line.
Reflection
Write a set of steps that you would use to complete the graph when you know a point on the line and the slope of the line.
Save in your Portfolio.
To accomplish this task, you start by plotting the point. Since the point is not the y-intercept, it will not be on the vertical axis.
You used the rise and run of the slope to move away from the y-intercept to locate another point on the line. You do the same thing here; use the slope to move away from the point to another point.
Now that you have 2 points, you can draw and extend the line through the points.
The interactive below will take you through the steps of drawing the linear relation with a slope of ¾ that passes through the point (-2, -3):
lineByHand2
Lines by Hand 2
Use the U2 Grids to complete the following questions.
For each linear relation, graph the line using the stated point on the line and the slope.
- The line passes through (3, 7) and has a slope of 2.
- The line passes through (4, -2) and has a slope of -3.
- The line passes through (-1,-7) and has a slope of 1/3.
- The line passes through (2, -3) and has a slope of -1/2.
CONSOLIDATION
Mathematical Processes
In this activity, the Mathematical Processes Connecting was the focus.
Open your document U2 Mathematical Processes and complete your record of when you made a connection between ideas you already knew and the new ones you learned.
Save to your Portfolio.
Reflection
Open your document Unit 2 Reflections.
Reflect on the new ideas, vocabulary, and skills that you learned in this activity.
How do they connect to the previous information that you know about linear relations?
Choose two sentence stems to lead your reflection today.
Congratulations, you have completed Unit 2, Activity 5. You may move on to Unit 2, Activity 6.