MFM2P
Unit 4: Using Our Skills to Solve Problems
Activity 1: Getting Started with Problems
Throughout the course, each activity had a focus on one of five specific mathematical processes. As you completed each activity, you documented your observations about using that specific process during your learning. In this final unit, you will focus on another two mathematical processes, Problem Solving and Communicating.
You will probably recognize that the other five processes, Reasoning and Proving, Reflecting, Selecting Tools and Computational Strategies, Connecting and Representing are embedded within Problem Solving and Communicating. As you solve problems and communicate your understanding, you will engage the other five processes as you select a strategy, apply various concepts to reach a solution, and then communicate your findings.
In the Mathematical Process document, key identifying phrases were listed for each process. There were also questions to ask yourself to aid in identifying the use of the process. Below are phrases and questions that are attached to the two new processes.
| Problem Solving | Communicating |
|---|---|
| I think about the most effective way to find a solution. | I use clear math language to explain a concept, solve a problem, discuss ideas or justify a solution. |
| I devise a plan to solve a problem. | I use proper math conventions like symbols, labels, units and formatting. |
| I draw a diagram or picture to help me solve the problem. | I use vocabulary in appropriate contexts. |
| I create a mathematical model. | I read and reread to understand the problem and identify key information needed. |
| I look for a pattern. | I interpret and summarize information from charts and graphs, providing appropriate detail. |
| I apply math concepts and skills I have learned to find a solution. | I present ideas in different ways for different purposes and audiences. |
| How does this problem remind me of an earlier problem? | Have I used a model or a diagram? |
| How can I use concrete materials or a diagram to solve the problem? | Have I stated the meaning of each variable? (e.g. Let x represent….)? |
| Which strategies can I use to solve the problem? | Have I shown how I used a particular tool or strategy? |
| What are the implications of the data that I have collected? | Have I connected this problem to previous concepts or to my knowledge of situations outside of math class? |
| Have I been able to make a conclusion? | Do I think about whether the answers that I present are reasonable? |
There are many references available for problem solving strategies. Common references are made to a four step model that includes:
- understand the problem
- make a plan
- carry out the plan
- look back at the solution.
Although this may be presented as a step by step process, it is often necessary to go back and revisit previous work. Open Problem Solving Steps to see the details for each step.
 Mathematical Processes
In this activity, the Mathematical Processes Problem Solving and Communicating are the focus.
Download and open your document U4 Mathematical Processes and read the descriptions.
As you complete the activity, notice when you are thinking about your solution and how it is being presented.
Insert your record below the description of the process.
Every year, there is a fall fair in Mathville. This year, the town is celebrating the 75th year of hosting local agricultural displays and competitions, students’ art work and construction projects from the local schools, vendors (definition:a person or company offering something for sale) with a wide array of products to sell, and a play area with amusement park rides.
Aerobatics Show
This year, the organizers are planning a special aerial show to celebrate the 75th anniversary. They received a list of the different maneuvers that The Ace Flying Club can perform and are in the process of finalizing their request.
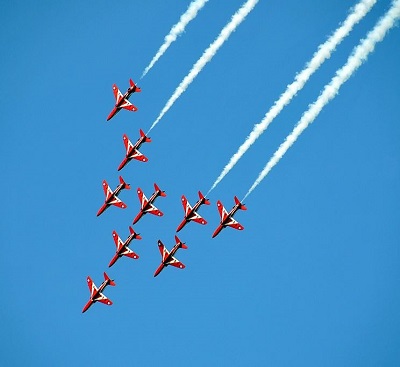
Some of the organizers viewed the aerobatics (definition:aerial acrobatics involving small aircraft) the previous year and were thrilled with one particular maneuver.
Sitting in the bleachers, they first saw the plane high in the sky and far away. They watched as the plane decreased its height and flew towards the spectators, a smoke trail behind.
The spectators gasped as it looked as though the plane was going to crash, but the plane changed direction and flew upwards. The spectators talked excitedly about the act. This maneuver was possible only because there was a large gully in front of the viewing area.
Luckily, there is an area in Mathville that can be used for this act.
The committee is interested in having this act performed at their event, but they are unsure of where to place the bleachers for the spectators. To make their decision, they need to know the path of the plane i.e., they need to know the change in height of the plane as it travels horizontally with respect to the ground.
One committee member, Erskine, has some data about the plane as it follows the flight path. The person who collected the data was directly in line with the plane; she saw the same view as the spectators. The observer started recording data when the plane began the act. She continued recording the height of the plane and the angle of elevation of the plane several times during the flight.
What might her recording look like?
What trend might be noticeable in the measurements?
Consider the side view of the flight path of the plane. Where would the observer be standing?
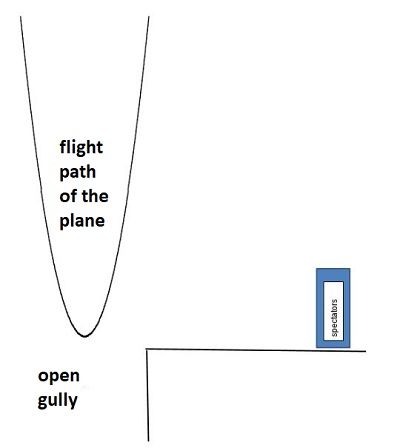
What might have been the position of the plane when measurements were recorded?
Think about the mathematical concepts that might connect to this situation, i.e. linear relations, quadratic relations, trigonometric ratios, similarity, proportionality or formulas.
Look at the information that Erskine has available:
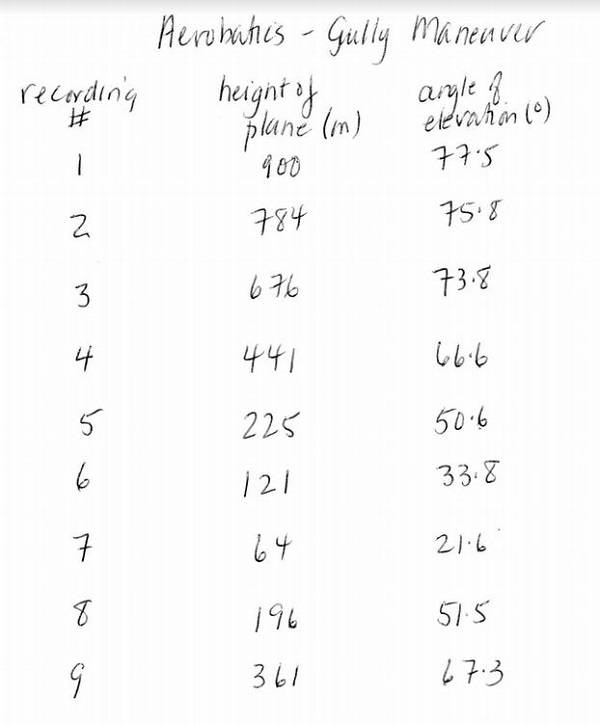
Did you anticipate that the height of the plane would decrease and then increase? The horizontal distance between the observer and the plane isn’t recorded. How would it change as she records the data? How can Erskine use the data to determine the flight path of the plane? What would you do next?
Watch the video and follow Erskine as he begins to analyse the data and think about his plan.
Draw and label triangles for the other data points.
In the video, the narrator stated "The last two recordings would be after the plane turned and is heading up. " How do you know this is true?
How will Erskine use the diagrams to determine the horizontal side length of the triangle? Do the triangles make you think of a problem that you have solved before? What strategies can you use to solve the problem?
The Important Book
You have been creating The Important Book to clarify the important concepts and skills in the different parts of the course.
Open your document. Do you have something written that gives you a suggestion about what you may do to start the problem? Do you need to add something? What would you add?
Keep your document open as you follow the activity. You may want to add to or change some of the information in your book. Save your document to your Portfolio.
Erskine does some calculations and continues to think about his plan. Follow his thinking by watching the following video:
Determine the horizontal values in the other triangles. Check your answers.
The horizontal values (distance between the observer and the plane) are stated along with the vertical height of the plane.
Height 441 m, distance 191 m; height 225 m, distance 185 m; height 121 m, distance 181 m; height 64 m, distance 162 m; height 196 m, distance 156 m; height 361 m, distance 151 m.
Reflection
You are focused on the Mathematical Process of Communicating.
Check your solutions against the model solutions provided.
Are your solutions complete as well as correct? In your solutions:
- Did you draw a diagram to illustrate that you were solving for a length in a right triangle?
- Did you label your diagrams with the correct values and did you include units in your diagrams?
- Was the unknown that you were solving for shown in the diagram?
- Was the relationship between the values (the height and the angle) and the unknown value (the horizontal distance) clearly indicated (the tangent relationship) at the start of the solution?
- Were all steps shown?
Save your reflection to your Portfolio.
For every vertical height, Erskine used the corresponding angle of elevation to determine the horizontal distance between the observer and the plane at that moment. He has a different pair of measurements, a horizontal distance and a vertical height. He mentioned in his planning that he needs to describe the flight path and wants to make a graph using the measurements.
Which measurement should be the independent value and which is the dependent value? How will he organize the information in the table? What will the table of values look like? How will this help him with his analysis?
Create the table of values that you think Erskine will make.
Watch the following video and listen to thinking aloud as Erskine continues to explore his data:
Did you notice how Erskine stopped and reflected on the graph? He compared the outcome with his expectation of what he would see. When they did not match, he became aware of how he needed to change what the variable x represents.
The relationship between the change in the horizontal distance and the height is:
a. Linear
b. Quadratic
c. Neither linear nor quadratic
b. Quadratic
The y-intercept for the relationship is:
a. (30, 0)
b. (0, 30)
c. (0, 900)
d. (900, 0)
c. (0, 900)
Create your own graph of the data. Open desmos. From the drop-down menu, select Notes and define the variables. In the next box, select Table and enter the data into the table of values. Use the horizontal distance from the beginning of the flight. Change the scale by using the wrench in the upper right corner. For x, -10 ≤ x ≤ 250 and for y, -50 ≤ y ≤ 1100.
To draw in the curve of best fit, you will use the standard form of a quadratic relation on the same page as the table of values in desmos.
Watch the video below and follow the steps to draw in the curve of best fit:
Using the values determined with desmos, you can now write the standard form of the equation for the quadratic relation: y = x2 - 60x + 900.
The x-intercept for the relationship is:
a. (30, 0)
b. (0, 30)
c. (0, 900)
d. (900, 0)
a. (30, 0)
The factored form for the relation is:
a. y = (x + 30)(x - 30)
b. y = (x + 30)(x + 30)
c. y = (x - 60)(x + 1)
d. y = (x - 30)(x - 30)
d. y = (x - 30)(x - 30)
The vertex of the parabola is:
a. (0, 30)
b. (0, 900)
c. (900, 0)
d. (30, 0)
d. (30, 0)
The equation for the axis of symmetry is:
a. x = -30
b. x = 30
c. y = 0
d. y = 900
b. x = 30
At 11 m from the initial measurement, the height of the plane is:
a. 81 m
b. 361 m
c. 333 m
d. 1681 m
b. 361 m
Erskine has analysed the data and created a model describing the flight path. He knows that he can predict the flight path of the plane. He can return to the committee and use the information to decide where to position the spectators.
If you were to attend the fair, which would you want to see?
- Would you want to see the plane coming towards you and then turn skywards?
- Would you want to sit in bleachers that are parallel to the flight path and watch the flight path of the plane?
Notice that the quadratic relation decreases, touches the x-axis and increases. Is it likely that a plane could follow this curve exactly? Mathematical models are used to represent data even when the model or equation may not be exact. In this case, the quadratic relation is the best fit that can be found for the data points. The height of the plane is shown in reference to the ground level of the spectators, which does not change. However, the ground level that exists below the plane does change, when it passes over the gully.
Entrance Ramps
The fair has displays in various buildings on the grounds. Many of the buildings are not easily accessible for those using a wheelchair. The committee has decided to purchase portable ramps that can be installed at the entrance and exits of some buildings.
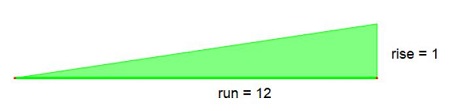
Alice has investigated the cost of purchasing ramps that can be used at the entrances. She found a company that offers a textured rubber ramp that will make different sizes according to their requirements. The cost of each ramp is determined by the volume of textured rubber used to make the ramps. She knows that the rubber costs 1.7 cents per cu. in. and all ramps will have a rise to run ratio of 1 : 12.
To order the ramps, Alice has to provide the company with two measurements, both of which depend on the height and width of the doorway at which they are being placed: the required height of the ramp at the entrance and the width of the ramp required. Alice has $500 to spend on the ramps, even though she knows they might cost more than that.
She has a list of measurements for the ramps at different buildings. Some buildings use the same door to enter and exit; these ramps must be 72 in. wide. All the other ramps will be 42 in. wide.
Alice is concerned that the total cost for this list of ramps might be greater than her budget allows. How can she make sure that her order stays within her budget?
The Important Book
You have been creating The Important Book to clarify the important concepts and skills in the different parts of the course. Open your document.
Do you have something written that gives you a suggestion about where to start or what to do?
Do you need to change something?
What would you change?
You may want to add to or change some of the information in your book.
Save your document to your Portfolio.
 Understand The Problem
Consider what Alice needs to do before she orders the ramps. Identify the information that Alice has.
What information does she need to provide to the company? Is there different information that she needs to calculate the costs? If so, what mathematics can she use to get that additional information?
Create a plan that Alice can follow to be able to be confident that she will remain within her budget.
Share your understanding of the problem with your classmates in a discussion. Include in your post:
- the information that Alice has
- the information that Alice needs
- a plan that Alice might follow. Choose one classmate and read the listing of information and the plan.
When reading the work of other students, make comments or ask questions. Possible sentence starters are:
- You wrote that … I didn’t consider that. Is that important?
- You used general words to … It would be clearer if you …
- You added … How do you know this information?
- I noticed … I wonder if …?
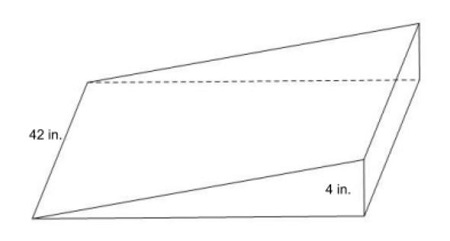
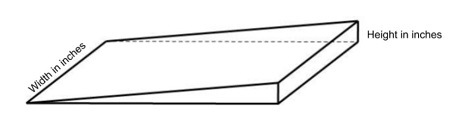
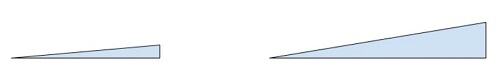
Alice draws a sketch of the first ramp and labels it. She thinks about the information she has and the information that she needs. Your list may be similar.
The information she has includes:
- cost of rubber per cu. in., 1.7 cents per cu. in.
- height of ramp, 4 in.
- width of ramp, 42 in.
- rise to run ratio is 1 : 12
- ramp is a triangular prism
The information she needs to be able to calculate the cost of this ramp includes:
- volume of ramp to calculate cost
- volume formula for a prism
- length of base to calculate volume
And she creates a plan to determine the cost of this one ramp:
- Use similar triangles to calculate the length of the base given the slope of the ramp (rise to run ratio) and the ramp height.
- Calculate the volume of the ramp in cubic inches.
- Calculate the cost for the ramp in dollars.
Alice chose similar triangles for her plan. In your discussion, did anyone consider using trigonometry or the equation of a linear relation in their plan? If you thought of using either trigonometry or linear relations, good for you! It is very possible to use other methods to solve this problem.
Drawing and labelling the diagram can bring different things to mind.
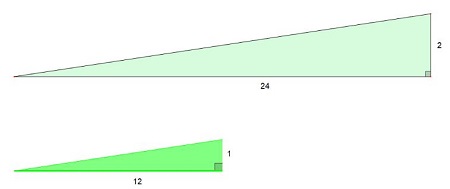
You may think about similar triangles and the lengths of the corresponding sides. You choose to use a proportion.
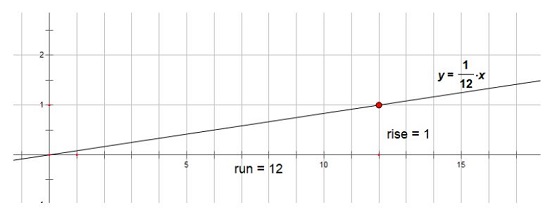
Labelling the rise and run values may lead to a connection with linear relations.
You choose to use the following equation:
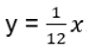
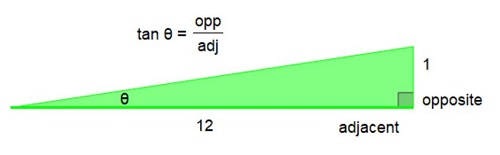
Noticing that it is a right triangle with 2 known side lengths may lead to a connection with trigonometry. You choose to use the tangent relationship.
Any of these methods can be used.
Alice completes the calculations according to her plan for the first ramp, Building A.
Step 1: Alice used the proportional relationship that she gets from the concept of similar triangles and lets x represent the unknown length, the length of the base of the ramp.
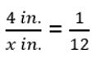
Solving for x, we find that the base of the ramp is 48 inches.
Step 2: Alice substitutes the calculated base from Step 1, the height, and the width of the ramp into the volume formula for a triangular prism.
The volume of the ramp is 4032 cu. in.
Step 3: She multiplies the volume, measured in cu. in., and the cost per cu. in. She adjusts her answer, which comes out in cents, to dollars, and finds that the cost of the ramp is $68.54.
If the other 7 ramps are at a similar cost, Alice may be able to stay within her budget of $500, provided some of the ramps are a little less expensive. Since each ramp is a different size, she really needs to check the cost of each ramp to see if she can stay within her budget before she places the order.
 Ramps
Ramps
You will work with a partner to determine the cost of each ramp and determine if Alice can purchase all the ramps and stay within her budget.
Once you have completed the analysis, you and your partner will prepare a report for Alice. The report will include your calculations and recommendation; it can be a written report, a presentation or a video report.
A table with the building information is available. Final values can be recorded in the table.
To complete the calculations:
- Begin with the plan that you shared in the discussion. Make changes if you wish.
- Share your plan with your partner and your teacher.
- Read your partner’s plan. Consider how your partner's plan is similar to your plan and how it is different. Make comments about steps that you agree with and ask questions if something is not clear.
- Return the plan with your comments to your partner.
- Review the comments that you received from your partner and your teacher.
- Decide on a plan to determine the cost for each ramp in consultation with your partner.
- Carry out the plan:
- Determine the cost for each remaining ramp.
- The total cost for eight ramps.
- Can she afford all the ramps?
- You may ask your teacher questions or ask for a Hint Card; both you and your partner must agree to ask.
Continue to work with your partner as you advise Alice about the purchase of the ramps. The cost for all eight ramps is greater than Alice’s budget.
- Determine one combination of ramps that gets within $50 of Alice’s budget without going over budget. Advise Alice about:
- the ramps that she will purchase
- the reason(s) for your selection of ramps.
- Check your answer(s). Are they reasonable? Did your plan make sense? Is there a better way to approach the problem?
- Prepare your report (a document, a presentation (slides) or a video). Include:
- final plan that you followed
- your calculations, a summary and your recommendation with reasons
- anything that you would do differently to solve a similar problem
- Submit your work to your teacher.
Your teacher will provide feedback on your problem solving and communicating.
The Mathematical Processes
Complete your entry for the Mathematical Processes Problem Solving and Communicating in the document U4 Mathematical Processes.
What did you notice about the choices that you made as you worked with your partner, following a plan.
Save to your Portfolio.
 Learning Skills and Work Habits Self-Assessment
Consider the learning skills and work habits you demonstrated as you completed this activity.
You are to complete this self-assessment of your learning skills in order to move on to Activity 2.
Your teacher will read your self-assessments and may use them to help you set next steps in your learning.
The Learning Skill you will focus on for this assessment is collaboration.
To remind yourself how collaboration can be demonstrated, click on the Learning Skills and Work Habits icon
Congratulations, you have completed Unit 4, Activity 1. You may move on to Unit 4, Activity 2.