MFM2P
Unit 4: Using Our Skills to Solve Problems
Activity 3: Setting Up and Solving a Problem
In Unit 1, you learned that you could represent relationships using graphs, equations, words, tables of values, and pictures. In this task, you will be matching a graph, an equation or a table of values to a verbal description.
matchingProblems
 Mathematical Processes
In this activity, the Mathematical Processes Problem Solving and Communicating are the focus.
Open your document U4 Mathematical Processes and read the descriptions.
As you complete the activity, notice when you are thinking about your solution and how it is being presented.
Insert your record below the description of the process.
In the Minds On task, you matched different representations of the same relation and defined the variables for the relations. As you continue in this activity, you will receive some additional information and a question to answer using the provided information. Advantages and disadvantages of different methods will be explored.
The Important Book
You have been creating The Important Book to clarify the important concepts and skills in the different parts of the course.
Open your document. You may want to look at the pages as you begin this activity. As you read and consider the questions, refer to The Important Book.
Perhaps you have written something that is connected to the problem? Perhaps there is something you want to add? Perhaps there is something you want to change?
Keep your document open as you follow the activity.
You may want to add to or change some of the information in your book.
Remember to save your document to your Portfolio.
Problem 1: Bobbleheads
Sophia collects bobbleheads from two hockey teams: the Sharpshooting Sharks (SSS) and the Checking Cheetahs (CC). Currently, she has 12 bobbleheads. The table of values includes a partial representation of the number of bobbleheads she has of each team.
Let the independent variable be the number of SSS bobbleheads; therefore the dependent variable is the number of CC bobbleheads.
| Number of SSS bobbleheads | Number of CC bobbleheads |
|---|---|
Are all possible combinations listed?
- What other ordered pairs can you add to the table?
- Can the ordered pairs include fractions?
- Is there a maximum number of ordered pairs that can be listed?
What equation could you write that will represent the relation?
- What will the variables in the equation represent?
What would the graph look like?
- Is it linear or quadratic?
- Will there be x or y-intercepts?
- If it is linear, does it increase or does it decrease?
Let’s look at what you started with and then other possible representations for this relation. You probably recognized from the table of values that this is a linear relation. (You can see the constant rate of change in the table of values.)
We add a few other ordered pairs to the table:
| Number of SSS bobbleheads | Number of CC bobbleheads |
|---|---|
We can extend the representations by letting x represent the number of SSS bobbleheads and letting y represent the number of CC bobbleheads.
We can therefore generate the following equation: x + y = 12.
We can also create a graph:
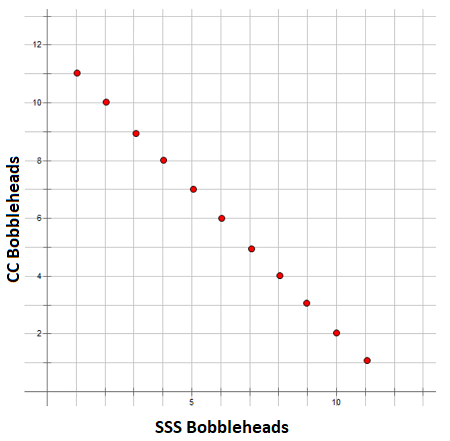
Consider the following statement: The number of each type of bobblehead can only be a positive integer value.
Do you agree with the statement? Why might it be important to think about the types of values that make sense within the context of a problem?
The equation shows the total when the numbers of each type of bobblehead are added. The graph shows the line x + y = 12, but only points that are positive integer values could be selected. Some of the possible combinations of bobbleheads are shown as points on the line.
Additional information is added to create a problem:
Sophia wants to double the number of Checking Cheetah (CC) bobbleheads in her collection this hockey season. If she does, she will have a total of 20 bobbleheads.
- How many bobbleheads of each team are in her current collection?
- How many bobbleheads of each team will be in her collection at the end of the season?
What information do you have? What information do you need to determine? What are you asked to do? How can you represent the additional information given?
Information you have:
- Sophia has some SSS bobbleheads
- Sophia has some CC bobbleheads
- currently Sophia has 12 bobbleheads
- at the end of the season, Sophia will have 20 bobbleheads
Information you need:
- current number of SSS bobbleheads
- current number of CC bobbleheads
- future number of SSS bobbleheads
- future number of CC bobbleheads
Create a plan:
- Define variables using items in the problem.
- Determine a model for the current number of bobbleheads.
- Determine a model for the future number of bobbleheads.
- Construct a strategy.
Start to work through the plan. You have already defined the variables for the current situation:
- Let x represent the number of SSS bobbleheads
- Let y represent the number of CC bobbleheads
You need to use the same definition for the variables throughout the solution. You are told that Sophia wants to double the number of CC bobbleheads.
She currently has ‘y’ bobbleheads, so at the end of the season she will have ‘2y’.
- She will continue to have ‘x’ SSS bobbleheads because this value does not change.
- At the end of the season Sophia will have 20 bobbleheads.
- The relationship can be represented by adding together the number of bobbleheads and showing that the total is 20, i.e. x + 2y = 20.
The model for the future number of bobbleheads is also a linear relation. How do you know?
So, there are two linear relations, both having to do with Sophia’s collection. Even though the two equations represent her collection at different times, both equations describe the relationship between the number of SSS bobbleheads and the number of CC bobbleheads. You need to find the right number of each type of bobblehead now that will result in the right relationship between the bobbleheads next season.
In Unit 3, you learned that two linear relations may have 1 point in common, the point of intersection. The point of intersection could be determined graphically or algebraically.
For this problem, you will look at a graphical solution and an algebraic solution. As you follow each solution, consider which method you would choose to solve the problem.
A Graphical Solution
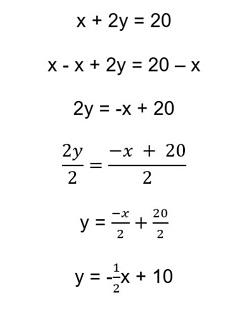
Use this information to create a table of values. You may want to rearrange the equation to slope y-intercept form to simplify the completion of the table.
| SSS bobbleheads | CC bobbleheads |
|---|---|
It is not possible to have 9.5 bobbleheads. Other odd numbers for x were not included in the table.
The dependent values in the table are determined using the relationship between the bobbleheads at the end of the season.
Plot the ordered pairs on the original graph. You may notice that the ordered pair (4, 8) is in the original table of values.
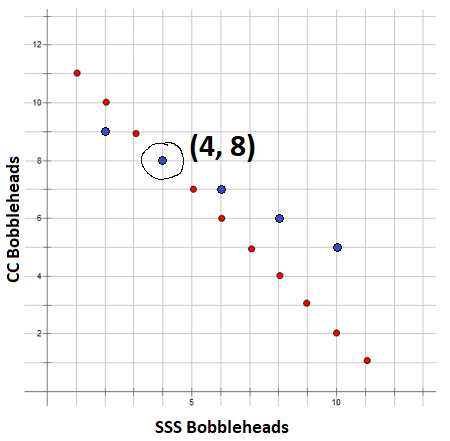
You can see that the point (4, 8) is included in both relations. This means that Sophia has 4 SSS bobbleheads and 8 CC bobbleheads. At the end of the season, she will have 4 SSS bobbleheads and 16 (2 x 8) CC bobbleheads. Adding the 4 SSS bobbleheads to the 16 CC bobbleheads, we can verify that Sophia will indeed have 20 bobbleheads in total, which was also required by the problem. Since the values are integers, you can be confident that you are reading the correct values from the graph.
In this situation, there are a limited number of choices of points along each line. Perhaps you thought it was just luck that you found the point easily. When you have a good selection of mathematical problem solving skills to choose from, you don’t need to count on being lucky. You can choose the skill that best suits the problem.
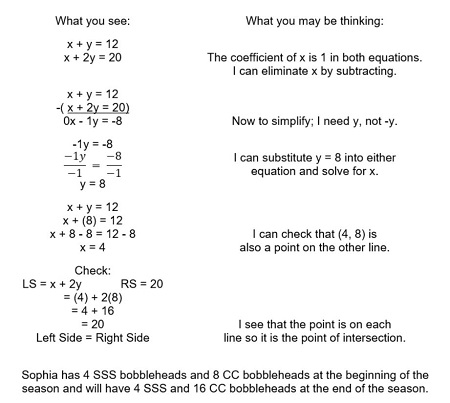
An Algebraic Solution
Let’s look at an algebraic solution now.
You have two equations that define the two relationships:
- beginning of season: x + y = 12
- end of season: x + 2y = 20, or you rearranged the equation earlier to:
where x is the number of SSS bobbleheads and y is the number of CC bobbleheads in Sophia’s collection.
Do you have information in your document, The Important Book, that will help you start to solve the problem using an algebraic method rather than a graphical method? What did you need to do to solve a system of equations algebraically? Do you need to rewrite the equations? Do you prefer to use substitution or elimination?
Since both equations are written in the alternate form, Ax + By = C, where A, B and C are integers, using the elimination method is more efficient in this case.
Choosing a Method
Which method - graphing or elimination - is more efficient according to you? Do you like to create tables of values and then plot points? Do you enjoy rearranging an equation to graph a line?
Consider: can you accurately read the point of intersection? Is it always possible to accurately determine the solution from a graph?
Do you like to work with the equations? Can you determine which variable is most easily eliminated first?
You have seen two solutions to the same problem using the skills of the course.
You may have solved the problem by working with the numbers in the table of values, a type of guess-and-check method i.e. you doubled all the values for CC bobbleheads and found the pair (SSS bobbleheads + double CC bobbleheads) that adds to 20.
| Number of SSS bobbleheads | Number of CC bobbleheads | Double CC bobbleheads | New total |
|---|---|---|---|
20 16 + 4 = 20 so this is the choice! |
|||
You may have solved the problem using logical reasoning with the integer values.
You might have thought:
- Sophia has 20 bobbleheads at the end of the season.
- Sophia started with 12 bobbleheads.
- Sophia increased her collection by 8 bobbleheads which are all CC bobbleheads
- doubling means having 2 groups of the same amount - the original CC bobbleheads and the new CC bobbleheads.
- the number of new CC bobbleheads is 8 so the original number of CC bobbleheads is also 8
- Sophia had 12 bobbleheads, 8 of which are CC bobbleheads.
- Sophia had 4 SSS bobbleheads
- She must currently have 8 CC bobbleheads and 4 SSS bobbleheads.
- Sophia has 4 SSS bobbleheads and 8 CC bobbleheads at the beginning of the season and will have 4 SSS and 16 CC bobbleheads at the end of the season.
Logical reasoning and guess-and-check (definition:strategy where you guess an answer and then check that the guess fits the conditions) may be useful in situations with a limited number of choices for a solution. They can be time consuming when the relationship is more complex.
You looked at different solution methods for the previous problem. Which method, solving graphically or solving algebraically do you prefer? Did one method produce a more accurate answer? How do you choose a method when you solve a problem?
You will continue with another one of the relations from the Minds On task. A relation is presented, variables are identified and an equation is written to represent the relation. Additional information is given and a question has been asked. There is now a problem to solve.
Problem 2: Pencils
Ms. Pantal welcomes students back to school with pencils. She spent a total of $24 on red and blue pencils. Red pencils cost $1.50 each and blue pencils cost $0.50 each.
What you already have: let x represent the number of red pencils and let y represent the number of blue pencils.
1.50x + 0.50y = 24
Question: Ms. Pantal has 28 students in her class so she buys 28 pencils; each student receives one pencil. How many pencils of each colour did she purchase?
You have an equation for one of the linear relations. How will you represent the second relationship, i.e. the possible combinations of red and blue pencils for the correct total? Will you solve using a graph? Will you graph by hand or graph using technology? Will you solve the system algebraically?
Watch the following three videos to see the different solutions for this problem:
In the videos, you may have noticed the narrator saying or writing 1.50x or 1.5x to represent the cost of the red pencils. Is there a difference? Using 1.50 and 0.50 in the initial equation makes the link to the cost, $1.50 and $0.50; money has 2 decimal places. For calculations, 1.50 and 1.5 are equivalent and it is acceptable to drop the decimals to complete a calculation.
With each method, the same solution was determined. Once again, we knew that the solution would be integer values (number of pencils) so graphing provided accurate values. Reading approximate values of the intersection point will be challenging when non-integer values are possible or when the scale on the axes requires that you approximate values for the ordered pair. Using an algebraic method will always lead to an exact solution, as you saw in the previous activity with the pyramids.
Problem 3: Coins
Consider another relation from the Minds On task.
When Moussa has change in his pocket at the end of the day, he puts the loonies and toonies into a coin jar in his room. He currently has 45 coins.
You matched a graph to the relation and noticed that either variable could represent the loonies and toonies. To create a problem to solve, you need more information.
 Discussing Coins
Determine a total value for the coins. Ask a question about the coins to create a problem to solve.
State:
- the information that you know
- the information you need to determine
- the meaning of the variables
Create a plan where you will choose an algebraic solution to the problem. Write the two equations that you will use to solve the problem. Share the value of the coins, your question and your equations with your classmates in a discussion.
Choose one classmate and read their problem and solution set up.
When reading the work of other students, make comments or ask questions. Possible sentence starters are:
- You defined the variable ‘x’ as … In your equations, ...
- You have a total value of … I see this …
- In your problem, you asked … Does the equation...?
- I noticed … I wonder if …?
 Coins
Coins
When you receive the comments from your classmate, make any adjustments to your problem.
Solve your problem algebraically and submit it to your teacher.
Your teacher will give you feedback on your solution.
The Important Book
You have revisited the topic of linear relations to solve some problems. Did you use The Important Book to bring to mind a concept that you had forgotten or needed to verify? Was the information already included or did you need to change your entry?
Review the rubric and remember to update your document as you complete this unit.
Save your document to your Portfolio.
You will be submitting your final version at the end of the unit.
Quadratic Relations
You have been solving problems that can be modelled using linear relations. Defining the variables gives meaning to the two values in the point of intersection. Other situations in real life cannot be represented using a linear model and require the use of other models. These problems may involve the use of a quadratic model, the use of trigonometric ratios, or the use of measurement formulas.
Problems Involving Quadratic Relations
You have learned to recognize and work with quadratic relations (y = ax2 + bx + c) where the coefficient of x2 equals 1, i.e. a = 1. Just as you saw that b and c can be different values, so can the value of a. Many real life situations can be modelled using a quadratic relation where a does not equal 1 (a ≠ 1). Quadratic relations can be used to model suspension bridges, to record the height of objects thrown through the air, or to determine optimal values (maximum or minimum values in a relation). You will be solving problems by interpreting graphs of quadratic relations.
Problem 4: Height of Ball
One of the relations in the Minds On represented the height of a ball over time. Similar graphs occur for any object projected into the air. The height of the object can be shown with respect to time or horizontal distance travelled and can be modeled with a quadratic relation.
The graph will be a parabola that opens down. When you graph the relation, you will notice that the coefficient of x2 is a negative value. The graph can be used to solve problems.
Do you have information in your document, The Important Book, to remind you of the key features of parabolas? Where is the vertex on a parabola? What is the significance of the vertex when a parabola opens down?
Feysal hits a baseball, and its height in the air is given by the equation, h = -5t2 + 17t + 1.5 where t is the time in seconds and h represents the height of the baseball. Open the desmos graph and enter the equation into box 2. Adjust the scale on both axes.
Use the graph to answer the following questions. Identify the key feature of the graph that you use to determine your answer.
- What is the maximum height of the baseball? At what time does it occur during the flight? Remember that you can read ordered pairs on a selected relation.
- How long does the ball travel through the air?
- What is the initial height of the ball when it is thrown?
- Over what time interval is the height of the ball greater than 10 m?
Information you have:
- equation that models the relation
- graph that models the relation
- definition of the variables
- points that show the position of the key features of the parabola
Information you need:
- the ordered pair of the vertex to know the maximum height and when it occurs
- y-intercept to know the initial height of the ball
- x-intercept that has a positive value, to know how long the ball travelled in the air
- time when the height of the ball first reaches the height of 10m, and time when the ball drops lower than 10m, to determine the time interval that the height was greater than 10m
Plan:
- use the graph to determine the required key features or points of intersection
- answer questions using the values in the ordered pairs
Watch the short video to learn how to extract the values from the graph in desmos:
Watch this second video to interpret the numbers in the ordered pairs:
The key features of a parabola are often the source of the information to answer the questions.
Problem 5: Suspension Bridge
The Lions Gate bridge connects the city of Vancouver to the North Shore, which includes the cities of North Vancouver and West Vancouver.

The bridge has three sections; the central portion or the main span of the bridge between the two towers and a section on each side that connects the main span to land.
The main cable of the bridge (the lighted string) is hung between the two towers. It is also attached to the deck of the bridge (the roadway) by a series of vertical cables called hangers. The main cable of the bridge can be modelled by the quadratic relation, y = 0.0009x2 + 5, where y is the height above the deck (the roadway) and x is the distance from the centre of the main span.
Check the graph that represents the main cable of the bridge.
Answer the following questions:
- What is the height of the main cable at the centre of the main span?
- Two towers, one on each side, support the main cable. Each tower is 55 m above the deck. How long is the main span of the bridge, i.e. the distance between the two towers?
- The vertical hangers attach the cable to the deck of the bridge. What is the height of the vertical hanger that is 110m from the centre?
Information you have:
- equation that models the relation
- graph that models the relation
- definition of the variables
- position of the key features of the parabola
Information you need:
- the ordered pair of the vertex
- y-intercept
- distance between the two towers
- height at a distance of 110 m from the centre
Plan:
- use the graph to determine the required key features or points of intersection
- answer questions using the values in the ordered pairs
The height of the cable at the centre of the main span is approximately:
a. 0.0009 m
b. 5 m
c. -300 m
d. 300 m
b. 5m
The main span is centred on the y-axis; the y-coordinate of the vertex (0, 5) of the parabola is the minimum height. At the centre, the cable is 5 metres above the deck
Two towers, one on each side, support the main cable. Each tower is 55 m above the deck. How long is the main span of the bridge, i.e. the distance between the two towers? Use the graph to determine the length of the span.
a. 236 m
b. 472 m
c. 241 m
d. 231 m
The main span of the bridge is 472 m. It is 236 m wide on each side of the central vertex, 236 x 2 = 472 m. Notice that the parabola is centred on the y-axis. In this case, the negative values are used in the solution.
The vertical hangers attach the cable to the deck of the bridge. What is the height of the vertical hanger that is 110m from the centre? Use the graph to determine the height. Round to the nearest tenth of a metre.
Enter the equation of the vertical line, x = 110 or x = -110 (position of the 2 vertical hangers). The order pair is (110, 15.89) or (-110, 15.89). The height of the cable is 15.9 m.
What other questions could you ask about the cable on the suspension bridge? What differences would occur if the model places one tower on the y axis?
Problem 6: Optimal Pricing
The organizers of the fall fair are reviewing the ticket price for the amusement rides. They know that if they sell ride tickets for $3 each, 800 tickets will be sold. Market research indicates that every time they raise the price by $0.20, the number of tickets sold will decrease by 40 but the revenue (definition:amount of money received from ticket sales) will increase.
The situation can be modelled by the quadratic relation: R = -8x2 + 40x + 2400, where R represents the revenue in dollars and x represents the number of times the ticket price is increased by $0.20.
Optimal Pricing
You will be working with a partner to determine:
- the maximum revenue
- how many times the ticket price is increased by $0.20 when the revenue is greatest
- the price at which the organizers will earn the maximum revenue
- the number of tickets they need to sell to get the maximum revenue
To complete the analysis:
- Identify the information given and the information that needs to be determined. Make a plan.
- Share your plan with your partner and your teacher.
- Read your partner’s plan. Consider how your partner's plan is similar to your plan and how it is different. Make comments about steps that you agree with and ask questions if something is not clear.
- Return the annotated plan to your partner.
- Review the comments that you receive from your partner and your teacher.
- Revise the plan in consultation with your partner. Use the most effective plan in this situation.
- Carry out the plan with your partner.
- Check your answer. Is it reasonable? Did your plan make sense? Is there a better way to approach the problem?
- Submit your work to your teacher. Include:
- final plan that you followed
- calculations, graphs and answers to the questions
- anything that you would do differently to solve a similar problem
Your teacher will provide feedback on your problem solving and communicating.
In this activity, you worked with linear relations and quadratic relations. You used a similar process to solve the problems. You continued to read and understand a problem and made a plan using the given information and knowing what you need to determine. As you used your strategy to answer the question, you monitored your work and made changes if needed. Finally you reflected on the reasonableness of your answer and reviewed the method that you used, making notes about changes that you may make in the future with similar problems.
Mathematical Processes
Complete your entry for the Mathematical Processes Problem Solving and Communicating in the document U4 Mathematical Processes.
Some questions to consider: Did you use diagrams to present the solution? Did you write your solution clearly so that others can follow your reasoning?
Save to your Portfolio.
The Important Book
You have revisited the topics of linear relations and quadratic relations to solve some problems.
Did you use The Important Book to bring to mind a concept that you had forgotten or needed to verify? Was the information already included or did you need to change your entry? Have you decided that there is something else to add to this slide?
Review the rubric and remember to update your document as you complete this unit.
Save your document to your Portfolio.
You will be submitting your final version at the end of the unit.
 Learning Skills and Work Habits Self-Assessment
Consider the learning skills and work habits you demonstrated as you completed this activity.
You are to complete this self-assessment of your learning skills in order to move on to Activity 4.
Your teacher will read your self-assessments and may use them to help you set next steps in your learning.
The Learning Skill you will focus on for this assessment is self-regulation.
As you complete the remainder of this unit, keep this learning goal in mind and consider how you might demonstrate that you have achieved it.
Congratulations, you have completed Unit 4, Activity 3. You may move on to Unit 4, Activity 4.