Resource Room
Performing and Recording (P/R)
MINDS ON

Use Equipment, Materials, and Technology Accurately and Safely
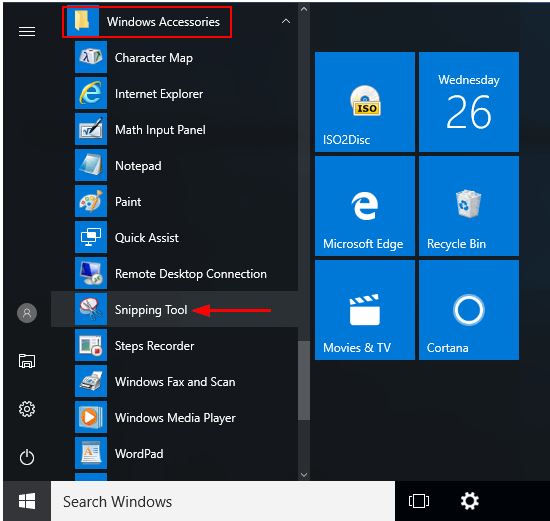
Images should be clear, properly cropped, labelled and embedded your work. The "How to Take a Screenshot website has clear instructions for almost every platform, i.e. Windows, Mac, iOS, Android, Chrome OS, etc..
Microsoft's Windows 10 comes with a Snipping tool that is also easy to use. It's usually found in the Start menu under the Windows Accessories submenu and will help you get images that are clear, usable and also simple to paste into a document like Word or Google Docs.
Gather, Organize, and Record Relevant Information from Research, and Data from Inquiries
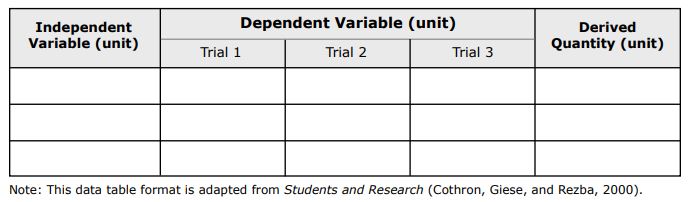
At a minimum, your observations should include details about your independent and dependent variables. Other details to consider include the control variables and qualitative observations that you would like to discuss later in your write-up.
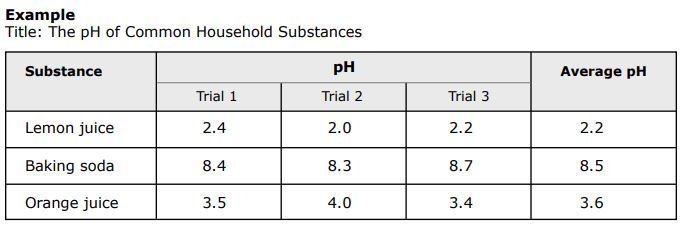
Guidelines for Making a Data Table
(modified WGBH Education Foundation)
In most cases, the independent variable (that which you purposefully change) is in the left column, the dependent variable (that which you measure) with the different trials is in the next columns, and the derived or calculated column (often average) is on the far right.
Your title should clearly state the purpose of the experiment (e.g., The effect of ____ (independent variable) on ______ (dependent variable).
Acknowledge Sources, Using an Accepted Form of Documentation
Most often in Biology sources of information are presented using APA format.
You can show citations in text.
If you want to view any links in this pdf, right click and select "Open Link in New Tab" to avoid leaving this page.
You can also show references at the end of text.
If you want to view any links in this pdf, right click and select "Open Link in New Tab" to avoid leaving this page.
There are easy to use websites to help you get the format right, like Purdue Online Writing Lab and automatic reference generators like Bibme, EasyBib and the Citation Machine, to name just a few.