Scientific Method
The Scientific Method - Designing Investigations
MINDS ON
Expanding a Balloon...Science Style!
What did you See? What are you Wondering?
After watching the scientist expand a balloon using a unique method, what observations can you make and what are you wondering about?
For example:
- Observations are made using one’s five senses: sight, sound, smell, taste, touch.
- Scientists make observations before, during and after an investigation.
- Example:
- The baking soda is a white powder.
- Example:
- Wonders are questions you have after an investigation about what you witnessed (observed).
- Example:
- I wonder why the scientist used a plastic bottle?
- Example:

Looking at the steps above, where are we in the experimental process?
 Observation & Wonder
- Record your observations and wonderings, about the demonstration you watched, using the Observation/Question Graphic Organizer.
- When you have completed the Observation/Question Graphic Organizer, SAVE the document in such a way that you can refer to it later .
ACTION
Popping Popcorn...Science Style!
Scientists will often observe an event or situation and use the scientific method to work through a solution.
In the Minds On activity, you initiated the scientific method by developing your skills to make observations and ask questions. In this activity, you will learn how to use your observations and create questions to design an investigation where you choose variables that you can manipulate to observe their impact.
Watch the video below to see how a scientist cooks popcorn using an unconventional method!
While watching the scientist pop popcorn using a unique method, consider what observations a student could make and what they could be wondering about. Consider using the Two-Column Graphic Organizer to organize your thoughts.
Planning an Investigation with the Scientific Method
U1A3Screen2a
CONSOLIDATION
Design an Investigation - Expanding a Balloon!
Now it is your turn! At the beginning of the lesson, we saw a young man inflating a balloon. A chemical reaction will produce enough gas to inflate the same balloon. Here we are going to design our first experiment!
Gather your tools for brainstorming!
- Review the video from the Minds On activity that showed a scientist expanding a balloon in a unique way.
- Review your Observation/Question Graphic Organizer that you saved from the Minds On activity.
Work through the interactive to design your investigation:
U1A3Consolidation
Investigation Design - Expanding a Balloon
- When you have completed the interactive design task, print your work to a PDF format and SAVE the document so that you can submit this to your teacher for descriptive feedback.
- When saving documents ensure you have named the file with a meaningful title so you can refer back to it easily.
Analyzing the Data - Expanding a Balloon...Science Style!
Now that you have designed the experiment, let's consider observations that were recorded by a group of students who conducted the same experiment.
- Data Tables allow scientists to collect and record qualitative and quantitative observations from an investigation in an organized way.
- From their observations, scientists can determine if their results support their original hypothesis (or not).
- Review the attached sample of student work that shows their collected observations for the Expanding Balloon investigation.
- Key things to look for:
- Students have organized data in a chart or table form.
- Students have recorded several trials and taken an average of their results.
- Students have recorded the control condition (what the original scientist did) AND their test condition (what they did).
- Students have recorded both types of data:
- Quantitative
- Observations involving measurements and numerical data.
- Qualitative
- Observations involving the 5 senses.
- Quantitative
Writing a Conclusion
- Now it is your turn!
-
Look through the data table and circle in red all qualitative data and information
-
Read through again and identify in purple, all quantitative data and information
-
Use the sample data given (above) to determine if the observations support the student's original hypothesis which was:
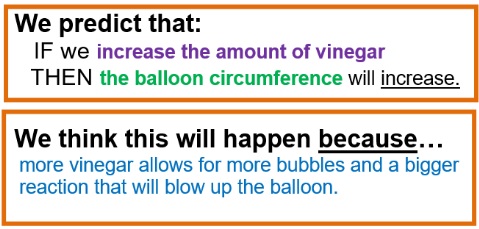
-