Motion (Kinematics)
Uniform Motion, Speed, Velocity, and Position-Time Graphs
MINDS ON
 Reflection
Grab a stopwatch or your phone.
Go somewhere where you can take about 30 walking steps uninterrupted (a long hallway, outdoors).
Start your stopwatch as you start walking (you’ll start on step 0), and press the lap button on every fifth step (steps number 5, 10, 15, 20…). Keep walking for about 30 steps, trying to maintain the same pace the entire time. Press ‘Stop’ on the 30th step. Jot down your lap times - you’ll need them later in the activity.
At the end of the 30 steps, create a reflection, and record your answers to the following questions:
- Were you able to maintain the same pace the entire time? How do you know?
- Was there a period of time when your pace of walking was faster? How do you know?
- Was there a period of time when your pace of walking was slower? How much slower was it than your fastest pace?
There is more than one way to determine how quickly an object (or a person) is moving, provided we know the amount of distance covered in a set amount of time. Read on to discover more about this calculation, and how the study of motion is changing our world!
ACTION
Speed and Velocity
Recall that to determine the displacement ( ) an object travels, we need the initial position (
 ) and the final position (
 ). But if we want to find the rate at which the object is moving (how fast?), we need to know one more piece of information: the time it takes for the object to change its position.
There are two ways we can measure these changes: speed and velocity.
Speed ( ) is the rate at which an object is able to travel a given distance. It is calculated by dividing the distance travelled by the time taken to travel.

It is a scalar quantity, and is measured in metres per second (m/s).
Velocity ( ) is the rate at which an object is able to travel a given displacement. It is calculated by dividing the change in position (which is displacement) by the change in time.

It is a vector quantity, and is also measured in metres per second (m/s). The direction associated with velocity is the same as the one associated with the displacement in the calculation.
Remember the symbol  ? It stands for “the change in,” so from the formula, we know that as an object moves, its distance changes (
 ), as time changes (
  - time always moves forward).
Throughout this activity, we will be looking at scenarios involving uniform motion: motion where the speed, or velocity, does not change.
Example
Consider the following road trip.
A car travels 25 km east, 42 km south, and then 25 km west. It makes this total trip in 1.5 hours. Can you determine the car’s speed, in km/h? Is it the same as the car’s velocity, in km/h? Let’s assume the car is travelling at a constant speed the whole time (highly unrealistic, but let’s keep it simple to start).
GRASP
As calculation questions get more complex, it’s a good idea to have a go-to method to approach the problem-solving process. A common method is known as GRASP:
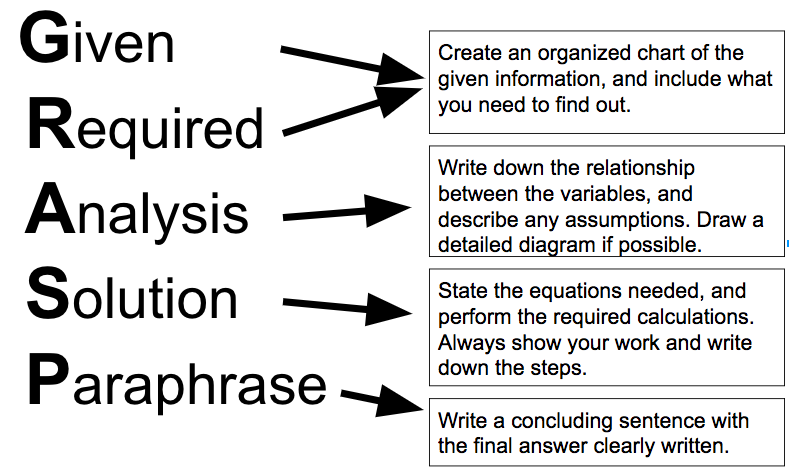
Using the GRASP method, let’s solve the road trip question.
Given: The problem gives us several distances the car travels, and a total time. We can organize this information:
![d_{1}= 25km\left [ E \right ]](_images/image_CbDBT.gif)
![d_{2}= 42km\left [ S \right ]](_images/image_xLEPu.gif)
![d_{3}= 25km\left [ W \right ]](_images/image_rwYmN.gif)
Required: We are being asked to determine the car’s speed and velocity. Let’s organize this, too:


Analysis: Drawing a diagram to scale helps us visualize the problem. It is ALWAYS recommended that you draw a diagram, wherever possible.
![This is an image of the car’s path: 25 km [E], then 42 km [S], then 25 km [W].](_images/image117.png)
Even though this might just be a sketch, make it as accurate as you can. In the image above, the distance of 42 km [S] is clearly longer than the distances of 25 km [E] and [W]. The east and west vector arrows should be equal in length, too.
We know that speed is equal to the change in distance divided by the change in time.
For velocity, we will need to determine our displacement. Recall that displacement is the change in position, relative to where the object started. This has been added, in red, to our diagram:
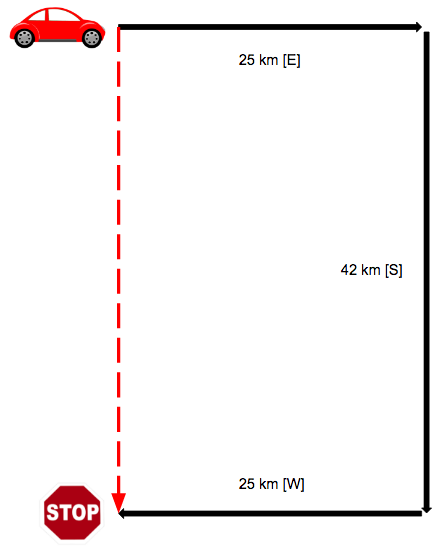
We can see that the length of the red arrow (displacement) is 42 km, pointing in the south direction. So we can write:
![\vec{\Delta d}= 42km\left [ S \right ]](_images/image_pHJHG.gif)
This will come in handy, later.
We know that the velocity is the displacement divided by the change in time.
Solution: We now have all the information and the tools needed to solve this problem. We have learned equations for speed and velocity -- let’s write them here.


For speed, we will be dividing the distance by the change in time. In this case, the change in distance is the total distance travelled, and the change in time is the length of time taken from start to finish.


Remember, we rounded to 61 km/h because our least precise measurement had just two significant figures.
To solve for velocity, remember we are referring to our velocity diagram above.

![\vec{v}= \frac{42\, km \left [S \right ]}{1.5\, h}](_images/image_LEa0l.gif)
Paraphrase: On the road trip, the car had a speed of 61 km/h, and a velocity of 28 km/h [S].
The GRASP method may seem tedious, especially for questions that only take a step or two to answer, but it is a good idea to get into the habit of following all the GRASP steps so that when we get to more complicated questions, you have a solid problem solving structure in place to make it easier.
 Mastery Check
- Rosana takes her puppy for a walk, but they can’t stray too far from home or the puppy gets nervous! They walk 342 m south, then 579 m north, all in a time of 12.3 minutes. What is their speed? HINT: convert minutes to seconds by multiplying by 60.
- 0.321 m/s
- 1.25 m/s
- 74.9 m/s
- 1151 m/s
Answer b. 1.25 m/s
Speed is not a vector quantity, so we only need to consider the distances given (not the directions).


- What was Rosana’s (and her puppy’s) velocity?
- 0.321 m/s [N]
- 1.25 m/s [N]
- 74.9 m/s [S]
- 1151 m/s [S]
Answer a. 0.321 m/s [N]
Velocity is a vector quantity, so we need to consider the distances and the directions given.
![\vec{\Delta d_{1}}= 342\, m\left [ S \right ]](_images/image_q7jJ0.gif)
![\vec{\Delta d_{2}}= 579\, m\left [ N \right ]](_images/image_I6rwb.gif)


![\vec{v}= \frac{342\, m\left [ S \right ]\, +\, 579\, m\left [ N \right ]}{738\, s}](_images/image_YvIjN.gif)
![\vec{v}= \frac{-237\, m\left [ S \right ]}{738\, s}](_images/image_XkQa1.gif)
![\vec{v}= -0.321\, m/s\, \left [ S \right ]](_images/image_kYjai.gif)
![\vec{v}= 0.321\, m/s\left [ N \right ]](_images/image_6ga6R.gif)
- Tom Cogwagee Longboat, of the Six Nations of the Grand River, is one of Ontario’s best known distance runners. In 1907, he set a new Boston Marathon record, beating all of the previous decade’s champions by almost 5 minutes! If he ran the 39.2 km course in 2 hours, 24 minutes and 24 seconds, what was his speed? HINT: we’ll need our units to be metres per second - what do you need to convert in the question?
- 0.221 m/s
- 0.272 m/s
- 4.52 m/s
- 17.5 m/s
Answer c. 4.52 m/s
First, let’s convert our quantities into metres and seconds, so our final answer will be in m/s.


Now, we can use our equation for speed:


- A sprinter runs all the way around a 400.0 m oval track, ending back where she started, in 52 seconds. What was her speed?
- 0.13 m/s
- 7.7 m/s
- 1.3 m/s
- 0 m/s
Answer b. 7.7 m/s


Speed
Speed is the rate of change of distance over a set amount of time. What does rate of change look like, visually?
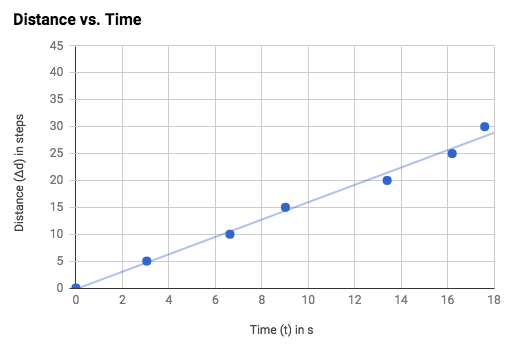
Go back to the task you did in the Minds On section of this activity (or repeat it if you do not have your lap times). Using a piece of graph paper (you can print one from here), let’s make a graph of the distance vs. time.
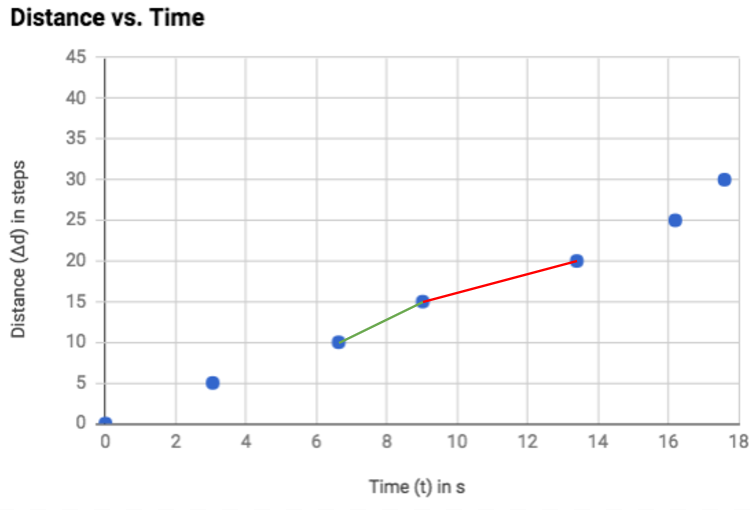
Your graph may look similar to the following image:

Note that time (on the x-axis) is the cumulative time -- you’ll have to add your lap times for each set of five steps. Make your graph as precise as possible; read on to learn more about drawing graphs.
Review - Graphing
Whether you are graphing manually or digitally, there are several important points to remember in order to keep your graphs accurate and clean.
At any time:
- Include a table of plotted values with proper titles and units.
- Make your plotted points as small as possible.
- Only use a legend if more than one set of data is graphed.
- Always include a title for your graph. The title should be “vertical axis quantity vs. horizontal axis quantity.”
- Always include the scale numbers of your quantities on both axes.
- Always include axis titles on both the horizontal axis and the vertical axis. These titles should include three items:
- The measured quantity (ie. distance)
- The symbol for that quantity (d)
- The unit for that quantity (m)
So the full axis title should be: Distance (d) in m
When drawing graphs by hand:
- Keep your pencil sharp for small plotted points and clean axes.
- Include a small circle around the plotted point to indicate that the point was obtained from a measured quantity.
- Make your graph as large as possible on the page.
- Make the graph as neat and clean as possible (always use a ruler).
- Unless indicated, do not “connect-the-dots” of the graph.
When creating graphs digitally:
- Insert grid lines where possible to make it easier to determine slope.
- Be sure to select “scatter plot,” not “line graph.”
- The points should be circles, not stars, diamonds, or other shapes.
Reflection
What do you notice about your graph? Create a reflection, and compare what you see in the graph with your answers to the Minds On questions in your journal.
Can you tell, just by looking at the graph, where you were walking more quickly (greater rate of change), or more slowly? Can you tell, from the graph, whether or not you were able to maintain a constant pace (constant rate of change)?
Try the activity a second time, but this time, purposefully vary the pace of your steps. For instance, walk at a fast pace for five steps, and then a much slower pace for five steps. Try a medium pace for a set of five steps - you could even try stopping for a bit in the middle of a five step set!
Graph the results again -- what do you notice? In your journal, record your answers to the following questions:
- What does walking at a slower pace look like on a distance vs. time graph?
- What does walking at a faster pace look like on a distance vs. time graph?
- How can I tell, by looking at a graph of how someone was walking, whether or not they were moving at a consistent pace?
We can also quantify how quickly someone is moving by determining their rate of change directly from the graph.
Review - Determining Slope
The rate of change between two variables (in our case, distance and time), is the change in one variable (distance) relative to the change in the other variable (time). Here, the rate of change is measured in the number of steps per second.
Question
On a graph, the slope of a line represents rate of change. There are a couple of different ways we can calculate rate of change.
From a table of values:
| Time (t) in seconds | Number of Steps |
|---|---|
| 0.0 | 0.0 |
| 3.05 | 5 |
| 6.63 | 10 |
| 9.02 | 15 |
| 13.4 | 20 |
| 16.2 | 25 |
| 17.6 | 30 |
Let’s say we want to determine the rate of change between step 10 and step 15. We take the number of steps that occur in that interval (15 steps - 10 steps = 5 steps), and divide it by the amount of time those steps took (9.02 s - 6.63 s = 2.39 s). Our calculation looks like this:

During that time period, the person walked 2.1 steps per second.
Using the same method, determine the rate of change of the above data between step number 15 and step 20. Check your answer when finished.

During that time period, the person walked 2.1 steps per second.
Comparing these rates of change to the graph, we can see that the greater the rate of change, the steeper the line on the graph. The green line in the graph below, which illustrates the rate of change of 2.1 steps per second, is steeper than the red line, which illustrates the rate of change of 1.1 steps per second.
From a graph:
Determining rate of change from a graph follows the exact same procedure, but instead of substituting values from a table, we determine the values from the graph itself.


You may recognize this as “rise over run” -- we are determining the difference between the values on the y-axis (the rise) and dividing it by the difference between the values on the x-axis (the run).
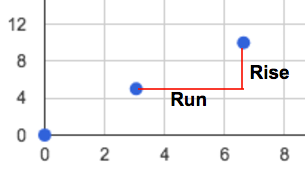
In the above case, the rise is 5 steps, and the run is 3.58 seconds, so again the rate of change is:

In general, to determine the rate of change, we take the change in (
 ) the dependent variable (y), divided by the change in (
 ) the independent variable (x). Mathematically, we can write:

Uniform Motion
So far in this activity, the rate of change we have been calculating has been the number of steps per second. While this is akin to speed, we don’t typically measure how fast someone is running by counting their steps. Instead, we look at how far they have travelled in a set amount of time.
Measurements of distance and time might look like this:
| Time (t) in s | Distance (Δd) in m |
|---|---|
| 0.0 | 0.0 |
| 2.0 | 2.5 |
| 4.0 | 5.0 |
| 6.0 | 7.5 |
| 8.0 | 10.0 |
Which, when graphed would look like this:
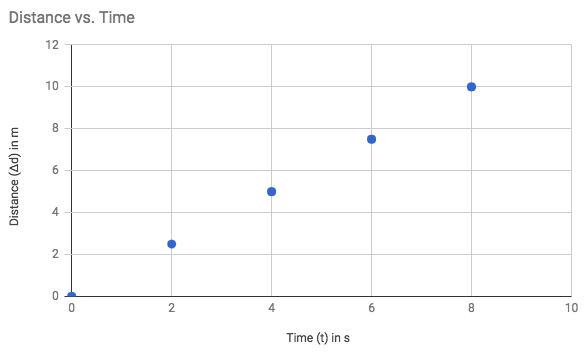
The data tell us that the object in question is moving at a rate of 1.3m/s.


This rate (1.3 m/s) is the object’s speed. We can see that the object is always moving at that same speed (we could check by calculating all the rates of change -- no matter when we measured the rate of change in the graph, it would still be 1.3 m/s), and in the same direction, so this object is undergoing uniform motion.
In math, you’ve likely seen graphs that have a positive slope, but also ones that have a negative slope. Can we have a negative slope on a graph that deals with rate of change of motion?
We can, but the sign of the slope (positive or negative) means something very specific: it indicates the direction of motion.
For instance, let’s take the exact same data we just saw, but specify that the direction the object is moving is to the east. By including direction, we are no longer just talking about a distance travelled, we are talking about a change in position.
| Time (t) in s | Position ( ) in m [E] ) in m [E]
|
|---|---|
| 0.0 | 0.0 |
| 2.0 | 2.5 |
| 4.0 | 5.0 |
| 6.0 | 7.5 |
| 8.0 | 10.0 |
We are going to create a position-time graph: a graph with time (typically in seconds) as the independent variable on the x-axis, and position (typically in metres) as the dependent variable on the y-axis.
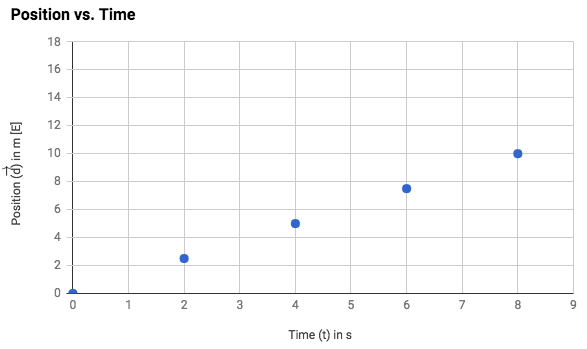
The calculation of the rate of change will be the same, too, but again, we specify direction.


![= \frac{5.0m[E] - 2.5m[E]}{4.0s - 2.0s}](_images/image_lQMIq.gif)
![= \frac{2.5m[E]}{2.0s}](_images/image_hkxBT.gif)
![= 1.3\, m/s[E]](_images/image_MjIMp.gif)
Seem familiar? We have just calculated the velocity of the object.
What if we had collected the following data?
| Time (t) in s | Position ( ) in m [E] ) in m [E]
|
|---|---|
| 0.0 | 10.0 |
| 2.0 | 7.5 |
| 4.0 | 5.0 |
| 6.0 | 2.5 |
| 8.0 | 0.0 |
You might have data like this if you are starting away from a specific reference point, and walking toward it. In this case, someone might be starting 10.0 m [E] from home, and walking westward toward home. Let’s graph this and see what it looks like.
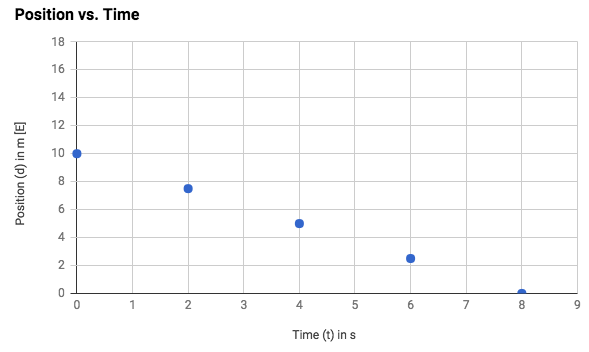
How does this change the velocity of the object? Let’s determine the rate of change from the graph:


![= \frac{5.0m[E] - 7.5m[E]}{4.0s - 2.0s}](_images/image_5LNJR.gif)
![= \frac{-2.5m[E]}{2.0s}](_images/image_0A8cc.gif)
![= -1.3\, m/s[E]](_images/image_o0C3R.gif)
The magnitude of the rate of change is the same (1.3 m/s), but the negative sign reminds us that the direction of the motion is reversed. We can say the velocity of this object is 1.3 m/s [W].
Finally, what about the following scenario?
| Time (t) in s | Position ( ) in m [E] ) in m [E]
|
|---|---|
| 0.0 | 2.5 |
| 2.0 | 2.5 |
| 4.0 | 2.5 |
| 6.0 | 2.5 |
| 8.0 | 2.5 |
Time marches onward, but the object is not changing its position (it is standing still). Graphically, this looks like the following:

We can also calculate the object’s velocity (can you guess what the velocity of a non-moving object is?):


![= \frac{2.5m\left [E \right ] - 2.5m\left [E \right ]}{4.0s - 2.0s}](_images/image_Qqmns.gif)
![= 0m/s\left [E \right ]](_images/image_bMKQO.gif)
In summary, when graphing distance vs. time, the rate of change (slope) is the object’s speed.
When graphing position vs. time, the rate of change (slope) is the object’s velocity:
- The velocity is positive when the object is moving away from a reference point (slope is positive, or increasing);
- The velocity is negative when the object is moving toward a reference point (slope is negative, or decreasing);
- The velocity is zero when the object is not moving (the slope is flat).
Average Speed
What if we were more interested in finding someone’s average speed for an entire trip, not just single segments of the journey?
Average speed is the ratio of the total distance to the total time to cover that distance. It is the rate of change over the entire time period. Average speed can be quite different than instantaneous speed, which is the speed at a particular instant in time.
Throughout the activity when you were timing your steps, especially in the second case, you experienced many different rates of change. However your average rate of change gives us a snapshot of your overall motion.
To determine average rate of change, we need to take the line of best fit from our graph, and determine the rate of change of that line. Here is the line of best fit for our original sample data:
But the line of best fit doesn’t go directly through any of our plotted points! So when we calculate the average rate of change, we cannot use any points from our table of values. We can, however, choose any nice points that lie directly on our line. There happen to be two points on the line of best fit that line up nicely on the grid: (10, 16) and (16, 26).
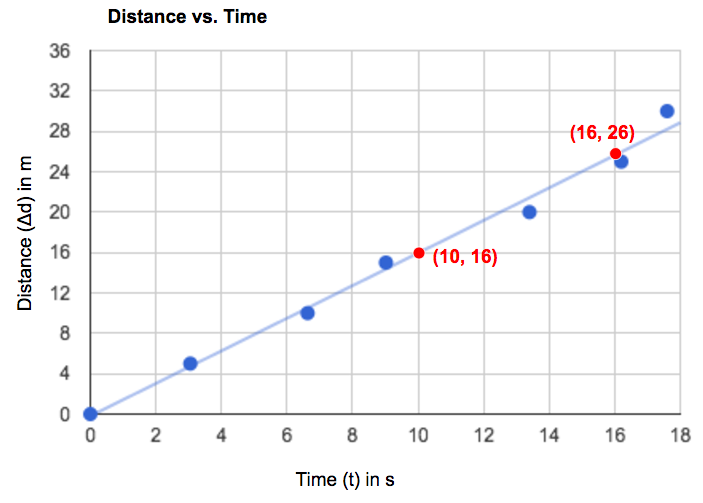
Let’s determine the rate of change using those points:

The average rate of change is 1.7 steps per second. Notice this value doesn’t tell us anything about the individual periods of motion -- it doesn’t tell us if the person walked at the same pace (1.7 steps per second) the entire time, or whether the person increased their pace and then stopped for a bit, averaging out to 1.7 steps per second.
In a distance-time graph, the average rate of change is the average speed. You’ll be exploring this in your next task.


 ) is the rate at which an object is able to travel a given displacement.