Interactions and Change
Reproduction on the Cellular Level
MINDS ON
Genetic Variance
In the Structures Unit, you explored various reproductive strategies that resulted in either genetic continuity or genetic variance.
 Challenge!
- Which reproductive strategy leads to genetic variance in offspring, rather than simply maintaining genetic continuity?
AnswerSexual reproduction.
- What is the difference between a diploid and haploid cell?
AnswerThe main difference between haploid and diploid cells is the number of chromosome sets found in the nucleus. Diploid cells contain two complete sets (2n) of chromosomes. Haploid cells have half the number of chromosomes (n) as diploid.
Important!
You've had a chance to review mitosis and how that process created daughter cells genetically identical to the parent cell. Each new generation of cells would therefore be a clone of the last generation. This type of cell division can used for growth, repair, maintenance, and asexual reproduction.
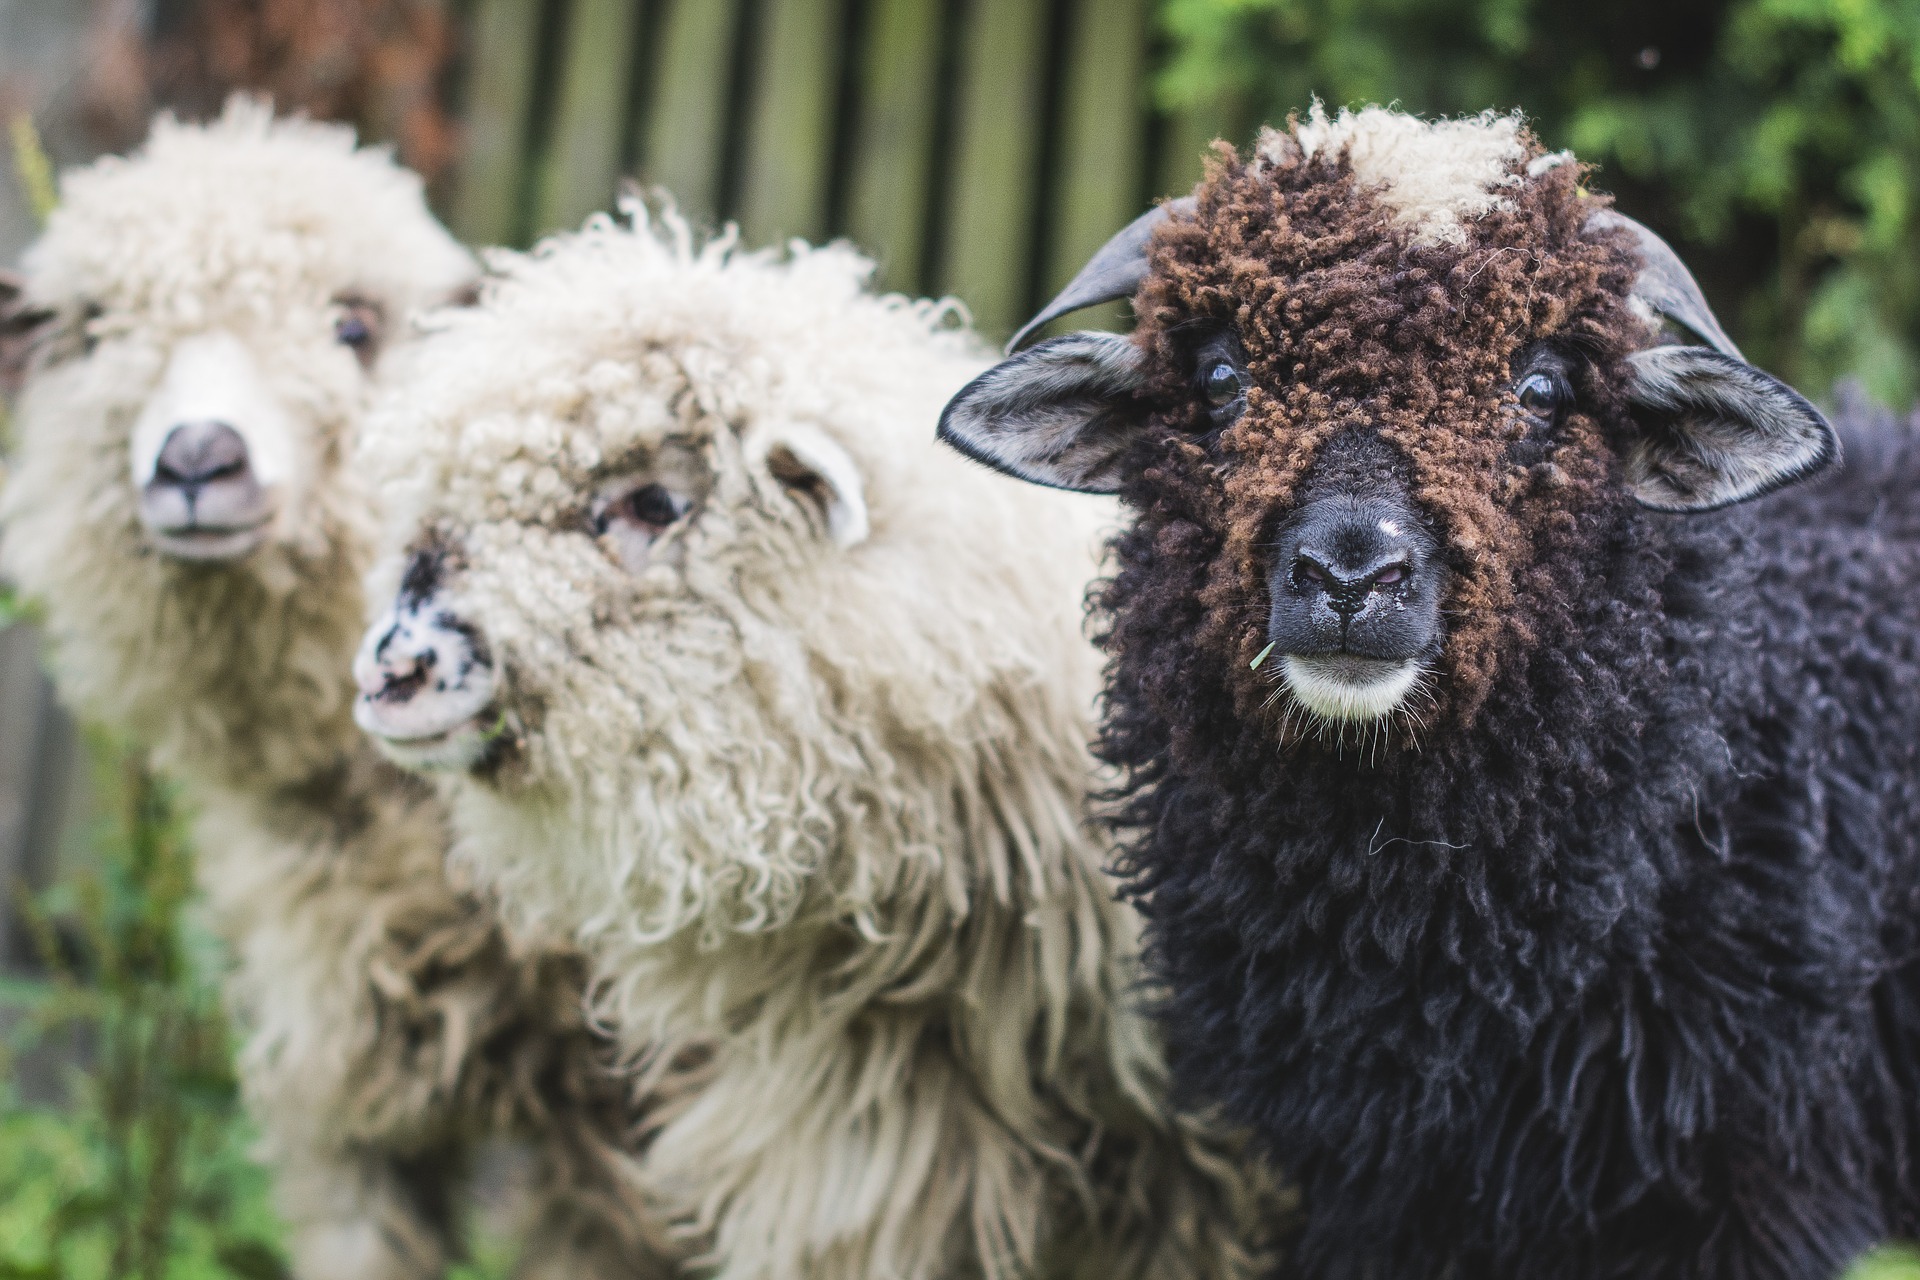
When looking at sexual reproductive strategies, you saw how combining genetic material from two parents can result in different traits. It was also mentioned that each parent can pass on different genetic material to each gamete, and this is why siblings with the same parents can display different traits from one another. This genetic variance plays an important role in natural selection and evolution, as you will see later on in this unit.
What Is Meiosis?
Meiosis(definition:A type of cell division that results in four genetically diverse daughter cells with half the number of chromosomes as the parent.) is the process that produces gametes that contain different genetic material from each other. In this activity, you will look at the phases of meiosis and investigate how it differs from mitosis. You will also explore how meiosis is a factor behind genetic variance.
Although the results are quite different, there are a number of similarities between mitosis and meiosis. In fact, many of the phase names are shared between the two processes. Some of the steps are virtually identical. It is therefore a good idea to compare the two prior to looking at the nuts and bolts of meiotic division.
 Mitosis versus Meiosis
The following video will play both processes side by side to allow you to compare and contrast each phase.
There are a lot of similarities between the two processes. The differences, however, have a profound impact on life and the variance we see between individuals of the same species.
You will now have a chance to explore the process of meiosis and the events within that process that result in gametes that are genetically diverse from one another. When a gamete combines with another gamete, it produces a daughter cell whose gender is determined by the combination of chromosomes. You will see how geneticists(definition:One who studies genes and the traits that they produce.) can map the chromosomes in a cell to determine information such as the sex of the organism.
ACTION
Genes and a T-Shirt

Before going much further, it is a good idea to refresh your memory about some of the basics of chromosome structure. A chromosome,(definition:Thread-like structure of composed of DNA that carries the genetic information of the organism.) which contains the DNA, holds the genetic information needed to maintain and grow the cell. A section of a chromosome that holds the information for one specific trait(definition:A distinguishing quality or characteristic.) is called a gene.(definition:A section of DNA that codes for a specific trait and that can be passed on to the next generation.) Multiple genes are located on each chromosome.
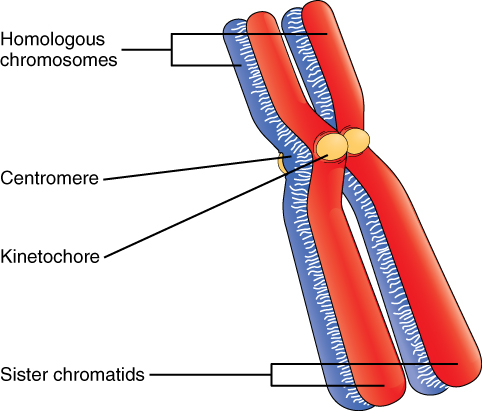
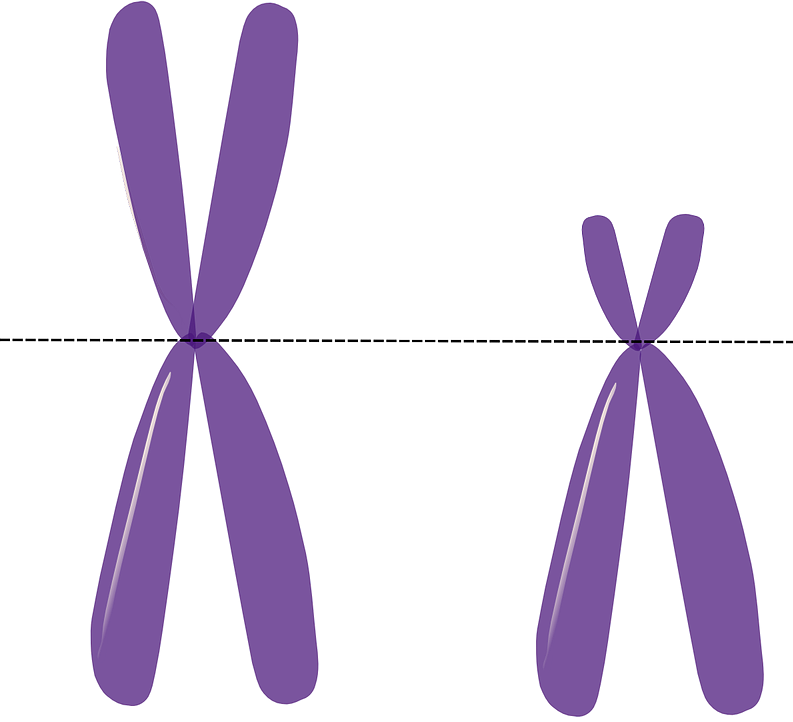
Here is the basic structure of a eukaryotic chromosome at metaphase:
by Wikimedia
The ‘X’ shaped chromosome is actually made up of two chromatids(definition:Either of the two daughter strands of a duplicated chromosome.) connected together at the centromere.(definition:The region of a chromosome that attaches the two sister chromatids together.) Each sister, or single chromatid, is a genetic copy or duplicate of the other. The coloured sections on the image can represent the different genes. As you can see, each sister chromatid would have a copy of each gene.
You may be familiar with all of those terms, but homologous pair(definition:A pair of chromosomes, one from each parent, which are similar in length, gene location, and centromere location.) may be new to you. Homologous simply means similar in structure and location. Each cell has a set of chromosomes from each parent, and the genes on those chromosomes are found in the same location or loci.(definition:A fixed position on a chromosome.) Offspring receive the same set of genes from each parent, but the way those genes are expressed may be different. For example, you will receive genes for hair colour and eye colour from each parent, but the genes from your mother may code for straight hair and blue eyes, and the genes from your father may code for curly hair and brown eyes. You can think of homologous chromosomes like a pair of shoes. Both shoes are the same in basic structure including colour, markings, type of laces, etc., but one is left and one is right. They may not be exactly the same, but together they make an obvious pair.
Why Do We Need Meiosis?
There is a clue in the name. The word meiosis is based upon a Greek word that means 'to diminish.' You know that each organism has a specific number of chromosomes in its body or somatic cells. For humans, that chromosome number is 46. Looking back at the reproduction strategies from Unit 1, you will remember that a gamete from each parent comes together to form the zygote. If the chromosome number in each gamete isn’t reduced or ‘diminished,’ then the zygote would have double the chromosomes that it should! A process is therefore needed to reduce the chromosome number. Gametogenesis is that process. A specialized diploid cell undergoes meiosis resulting in haploid cells.
Remember that a normal body cell has the diploid number of chromosomes (46 for humans), and the gametes have the haploid number (23 for humans).
Did You Know?
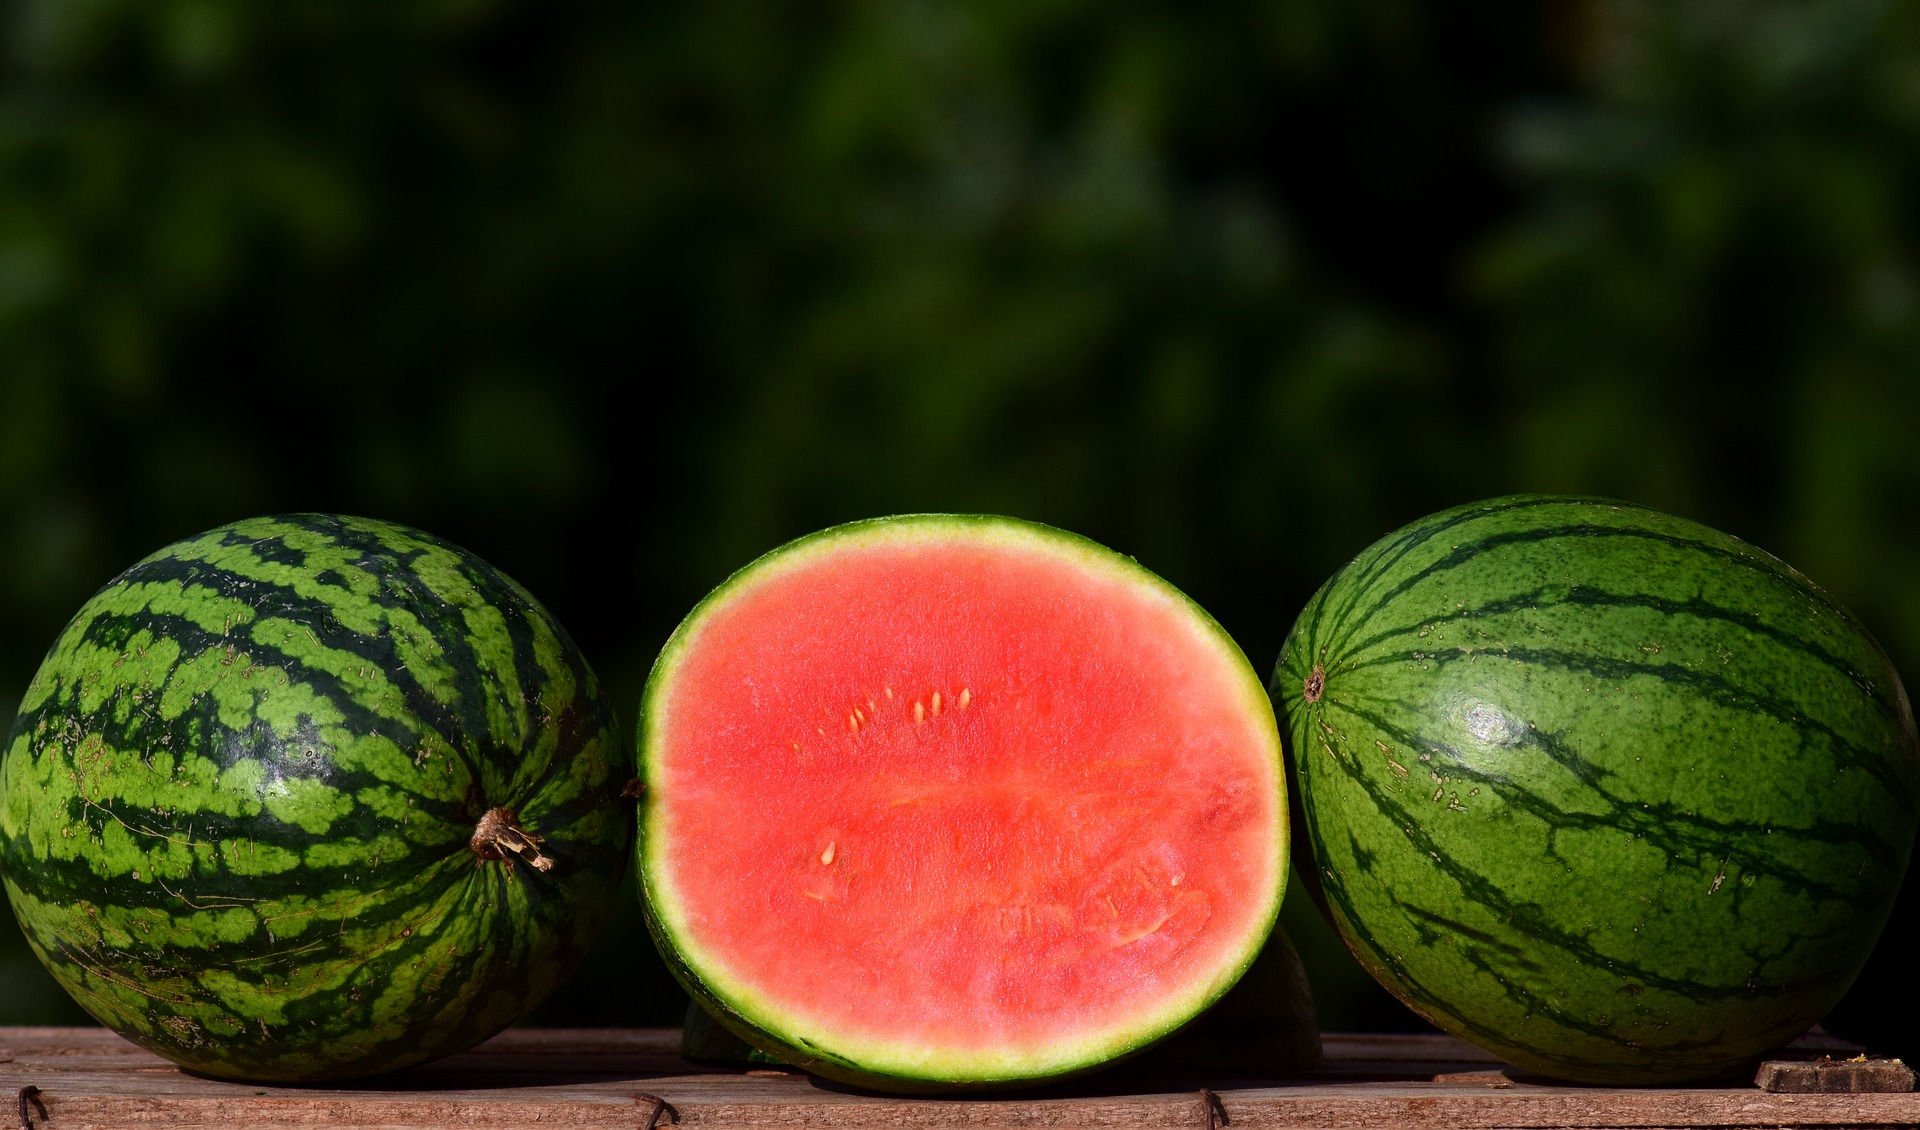
Although the process of meiosis reduces the chromosome number to produce zygotes with the normal diploid chromosome number, some organisms have a polyploid(definition:Having multiple sets of chromosomes.) condition, meaning that they have multiple sets of the chromosomes in their cells. This is a situation often induced in agriculture, as the polyploid condition can produce desirable traits.
For example, polyploid fruit are often sterile, and therefore do not produce seeds. Next time you eat a seedless grape or watermelon, you have the polyploid condition to thank!
This may sound like a broken record (uh, for those people who are younger, this is a reference to a scratched vinyl record which skips and keeps playing the same section over and over again), but remember that meiosis is also the process that allows for variation between gametes. This is a big deal in terms of diversity.
Challenge!
How it All Works
The process of meiosis is a good example of interactions in Biology. There are many videos and simulations that go through the steps of meiosis and give a good overview of the process. Having a good understanding of the process as a whole will make following the individual steps a bit easier. Before you look at each phase in detail, take a few minutes to go over this video. As you watch, try to keep track of the chromosome number. At what point does the cell go from diploid to haploid?
Homologous chromosome tetrads,(definition:A pair of homologous chromosomes, containing four chromatids.) crossing over,(definition:A process where homologous chromosomes exchange genetic material.) two rounds of cell division, and random, independent assortment(definition:Formation of random combinations of chromosomes during meiosis.) are all aspects of the meiotic process that are quite different from mitosis. Let’s take a look at the main phases of meiosis and then how those aspects listed above create that variation I just can’t seem to stop talking about.
Set Phasers to Stun!
As you have seen, the basic phases of meiosis are quite similar to mitosis, only there are two rounds of cell division. In addition, a few of the events that occur are unique to meiosis.
Scoping Out the Phases
It’s relatively easy to identify the various meiotic stages from diagrams, but how about the images from a microscope? The following interactive will test your skill at determining which phase is which.
 Scoping it Out
Using the microscope interactive below, view the slide that contains developing pollen cells from a Lilium plant. Using your good independent work(definition:I will be complete the meiosis microscope activity and identify the different stages.) skills, you will create a biological diagram of two separate cells, each showing a different phase of meiosis. One should be from meiosis I and the other should be from meiosis II. Refer to the Resource Room for the biological diagram rules. Be sure to label the chromosomes, cytoplasm, and the cell membrane. The title of the diagram should indicate the phase of meiosis it depicts. In addition, add a short paragraph to indicate how you know which phase the diagram is depicting in your diagrams, and indicate the main events of that stage.
Phases
Whoops! On your way out of the microscope lab, you mistakenly knock over a box of prepared microscope slides. Each slide contains a single cell in a specific phase of meiosis. The issue is that the lab technician didn’t attach the labels to the slides yet! You don’t want the technician to lose his job, so hopefully you can help him determine the phase depicted on each slide.
In the following interactive, you will attach the appropriate label to each slide. Be sure to check your work after you have arranged everything to make sure you have labelled the slides properly.
Slides
Maybe you should be more careful in the lab next time, but thanks for making it right!
Major Events
Now that you have a good understanding of the phases of meiosis, it is time to look closer at the unique events that occur in the process.
Crossing Over

The most important event in terms of creating variation occurs in prophase I. Earlier you learned about homologous chromosomes. This is the point at which those chromosomes pair up in a process called synapsis.(definition:The pairing of two homologous chromosomes to form a tetrad.) Each chromosome is made up of two identical sister chromatids. This tetrad consists of two homologous chromosomes (one from each parent) for a total of four chromatids.
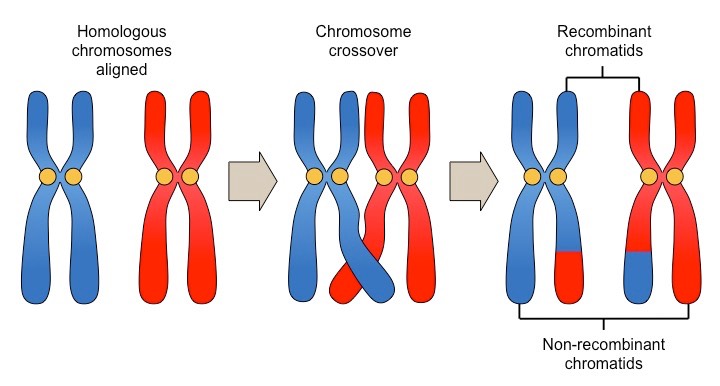
by Bio Ninja.com
Once synapsis has occurred, non-sister chromatids will ‘crossover’ and exchange genes. Remember, the genes are all the same on homologous chromosomes, so a gene for hair colour from one chromatid will exchange for the gene for hair colour on the other chromatid.
Although you will look at the interaction of genes that make the characteristics of an individual in the next activity, now is a good time to clear the air about a few terms. You may have heard the word ‘allele’ used in place of ‘gene’ a number of times. Can these words be used interchangeably? Let’s take a look!
So, an allele(definition:One of the possible forms of a gene.) is one of the possible forms of a gene. Now you know!
Once the chromatids have completed the crossover, they are called recombinant chromatids(definition:Chromatids that are comprised of exchanged genetic material from crossing over in meiosis.), since they are now made up of genes combined from two different chromatids. The recombinant chromatids now contain genes from both original chromosomes. As you can imagine, this random exchange of genes is a major source of variation among the chromatids.
On average, it is estimated that two or three crossovers occur for each pair of homologous chromosomes. These crossovers can occur anywhere on the chromosomes, and the multiple crossovers can happen simultaneously. Think of all the possible combinations that can occur!
This quick video will help you visualize the process:
Independent Assortment
After the crossover in prophase I, the tetrads align their centromeres along the middle of the cell during metaphase I. Spindle fibres from one pole attach to one of the homologous chromosomes, and fibres from the other pole attach to the other homologous chromosome. The homologous chromosomes are then pulled apart during anaphase I and start to migrate to opposite poles.
In the process detailed above, there is another event that adds to the genetic variance. When the tetrads align in the centre, it is a random arrangement. A homologous chromosome could go to either pole depending on how it was arranged in metaphase I. This means that the chromosomes in each homologous pair are assorted independently from the other pairs. The result is that one pole could receive chromosomes from both the female and the male parent. The process is random.
The number of combinations that can result from this process by the end of meiosis II depends on the number of chromosomes pairs that species has. Using the relation 2n, where ‘n’ is the number of chromosomes pairs, you can determine the number of possible outcomes.
For example, if there were only two pairs of homologous chromosomes, you would have 22 = 4 possible combinations after the homologous chromosomes are split during anaphase II.
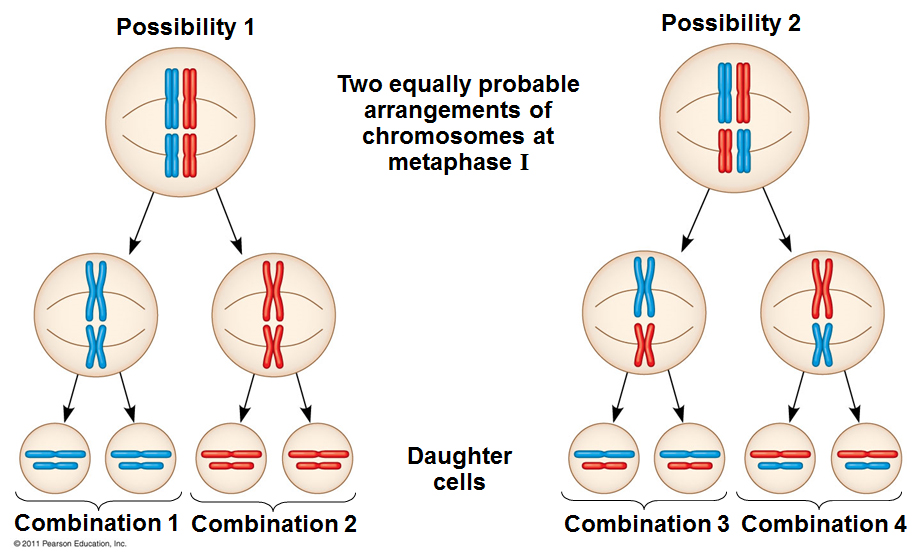
by Pearson Education Inc.
Since humans have 23 chromosome pairs, that would be 223 = 8,388,608 possible combinations! Now, that number is just based on independent assortment. If you include all the variation that occurs during crossing over in prophase I, you will have an almost limitless number of possible combinations! You can now see why we all look different from one another, even when we have the same parents.
One parent cell becomes four daughter cells, each being genetically different from the others and the original parent cell.
And THAT is why sexual reproduction and the process of meiosis is a main driver of genetic variance within a population. You will see that another process, mutation, also plays a large role in genetic variation later in this unit.
Diploid to Haploid
Although the idea of meiosis being a reductive process has been mentioned, it is very important that you remember that the end result of meiosis is four haploid cells. The diploid number drops to the haploid number of chromosomes at the end of meiosis I, and then continues in the haploid configuration all the way through meiosis II.

by Nelson Biology 11
When the two gametes combine during fertilization, the zygote will be back to the diploid number of chromosomes.
Unfortunately, the process doesn’t always go as planned. The goal is to have each of the four daughter cells contain the haploid number of chromosomes, but this isn’t always the case. In rare cases, the chromosomes do not separate equally during anaphase I or anaphase II. You will take a detailed look at this process in the next activity.
Gametogenesis

Nope, gametogenesis(definition:The meiotic process that results in the creation of male or female gametes.) is not a video-game console from the late 80s! Instead, it is the name given to the formation of sex cells through meiosis.
Now that you know the phases of meiosis, it is easy to make the jump to gametogenesis and understand the differences between the male sperm and the female eggs produced through the process.
Explore this video to see the main differences between the sperm cells and eggs cells produced through the process of meiosis. Pay close attention to the end result of each process and the names associated with each stage.
The formation of sperm cells in the male testes is called spermatogenesis,(definition:The production of four haploid male sperm cells through the process of meiosis.) while the formation of eggs in the female ovaries is called oogenesis.(definition:The production of one viable haploid female egg cell through the process of meiosis.) As previously mentioned, the big difference is found between the final form of the male and female sex cells.
The sperm cells need to be highly motile, so they form whip-like tails to allow them to swim to the female egg. In addition, they are quite small, as this is an advantage when it comes to their ability to move quickly.
In the formation of egg cells, the majority of the cytoplasm and the organelles contained within the cytoplasm, goes to one of the sex cells. This one large sex cell now has the nutrients and cellular make-up available to support a developing zygote after fertilization. The three smaller cells, called polar bodies,(definition:Small cells produced during oogenesis that do not develop into a viable egg.) die. This leaves just one egg or ovum(definition:A female gamete.) available for fertilization.
Another major difference is the number produced. Females will release only one egg per month, while males will produce 1500 sperm cells a second! Why such a big difference in number? Only one egg and sperm is needed to create a zygote, but the race for the egg is very competitive, and very few sperm make it to the egg. If there were fewer sperm released, the probability of fertilization would drop dramatically.
Using your good self regulation(definition:I am able to think critically about the terms in the gametogenesis interactive.) skills, test your understanding of gametogenesis by attempting the following interactive. Fill each box with the appropriate term or number. Some options can be used more than once. Be sure to check your work when you think you are finished!
Gametogenesis
Karyotypes
by By Doc. RNDr. Josef Reischig, CSc. - Author's archive used under ShareAlike CC BY-SA
Do chromosomes really look like the letter ‘X?’ For the most part, yes! Obviously the X shaped image used to depict a chromosome has been simplified, but the basic structure is similar to the real deal.
The chromosomes in a cell are many different sizes, and some have shorter arms on one end. In fact, the chromosome that determines if you are a male looks more like a Y than an X, since the arms on one end are very short.
From your study of meiosis, you know that there are homologous pairs of chromosomes; one from the female and one from the male. Cytogeneticists(definition:A geneticist that studies the structure and transfer of chromosomes and genes.) can look at the chromosomes from a cell, pair the chromatids into homologous pairs, and determine if the sample tissue comes from a male or female and if it has any chromosomal abnormalities. You will learn more about these abnormalities and how they occur in the next activity.
An image of the chromosomes in their homologous pairings and arranged based according to shape and size is called a karyotype.(definition:An arrangement of the the complete set of homologous chromosomes found in a cell.) The scientist will use special chemicals to ‘freeze’ and stain the chromosomes of white blood cells while the cell is in metaphase of mitosis.
Challenge!
Why would scientists use cells that are in metaphase to create a karyotype?
While in metaphase, the chromosomes are condensed, and sister chromatids are still attached at the centromere.
The Puzzle of Life
As you can imagine, it takes lots of experience and a trained eye to be able to match homologous chromosomes. The banding patterns and the location of the centromeres on the chromosomes help the scientist arrange them accurately. It really is like a jigsaw puzzle. Thankfully, computers are able to do this job quickly and accurately and make the process much more efficient.
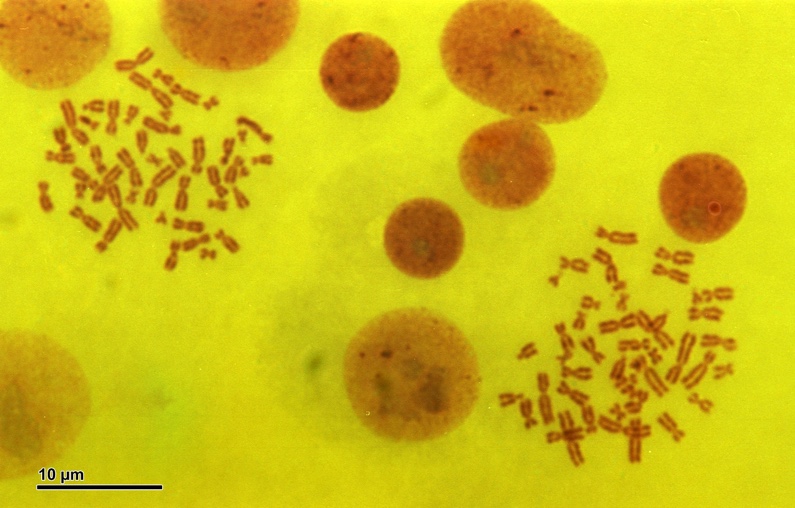
The process allows you to go from a metaphase smear(definition:An image of the full set of chromosomes from a cell in the metaphase stage of mitosis.) of somatic cells to a fully arranged karyotype.
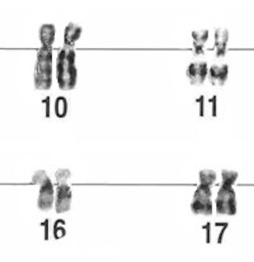
From this:
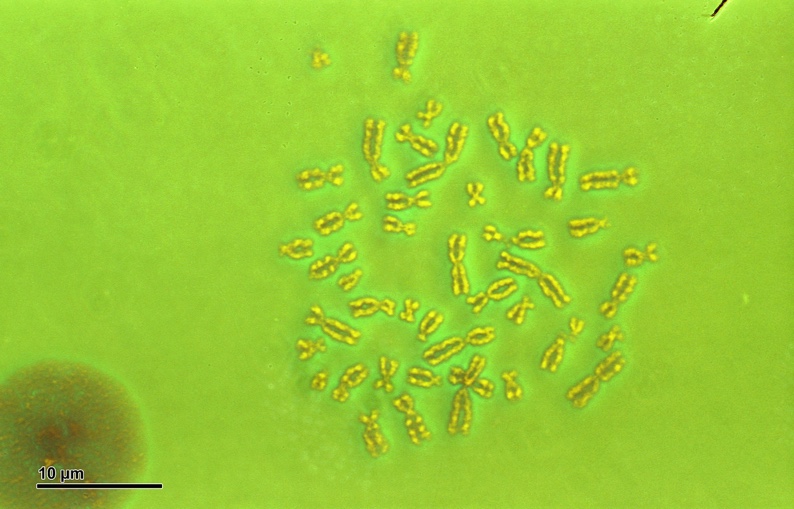
by By Doc. RNDr. Josef Reischig, CSc. - Author's archive used under ShareAlike CC BY-SA
To this!
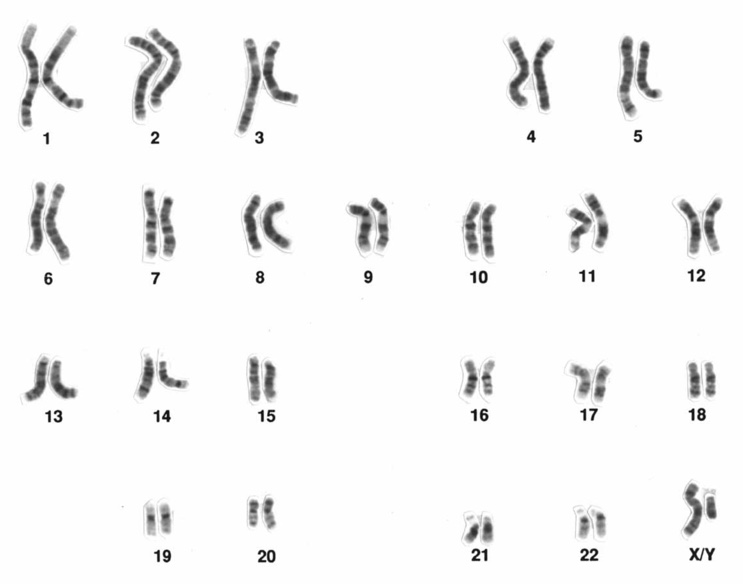
You can see that human karyotypes are arranged into the 23 pairs of chromosomes. The first 22 pairs are called autosomes,(definition:Chromosomes that are not sex chromosomes.) or non-sex chromosomes, while the chromosomes of the 23rd pair are called sex chromosomes. The sex chromosomes are what distinguish male from female. In humans, a female has two X chromosomes in that location, while a male has an X and a Y chromosome.
In actual fact, both chromosomes are still in the X configuration, but the Y chromosome has the centromere close to one end. This makes it look more like the letter Y.
A Source of Confusion
Often people see the chromosomes in the karyotype and think that they depict single chromatids as compared to the X shape shown above. The reason that many of the chromosomes look like single strands is simply due to the two sister chromatids being very close to one another. The resolution of the microscope can’t distinguish between the two sister chromatids.
On the metaphase smear at the top of this section, the lighting and contrast used enables you to see the classic X configuration. The distinction between the two chromatids is simply lost in many karyotypes due to the settings used.
In this example, you can just make out the X shape on a number of the chromosomes.
Reproduction Equals Life...Or Does It?
In Unit 1, you saw how organisms can reproduce using asexual or sexual mechanisms...or both! Reproduction has always been the mainstay of life, and is in fact one of the factors that are necessary for us to consider something to be living.
But what happens if that reproduction relies on others to make it happen? What happens if that organism contains genetic material - the molecules of life - in the form of DNA or RNA? Should that organism be considered life? You be the judge!
Viruses
In the last unit, you looked at all the various kingdoms, but what about viruses? You hear about viruses all the time, in that they are responsible for many serious infections such as HIV and rabies, so why are they not listed as one of the kingdoms?
The reason is simple: viruses are not living organisms. They do not adhere to the seven basic characteristics of life, but more about that soon. Even though they are not considered to be living, they are intimately connected to life. As previously mentioned, they are the cause of numerous diseases in plants, animals, and other organisms. In fact, they actually contain genetic material in the form of DNA or RNA!(definition:Ribonucleic acid, genetic material present in all living cells. Its principal role is to act as a messenger carrying instructions from DNA for controlling the synthesis of proteins.) The DNA viruses are responsible for diseases such as hepatitis B, cold sores, and respiratory infections, while the RNA viruses cause diseases such as measles, polio, and the common cold.
Viruses are very abundant. It is said that there can be millions of viruses in a single mL of ocean water! Thankfully, most viruses have specific host cells that they infect. Some will only infect plant cells, while others, only bacteria.
Viral Structure
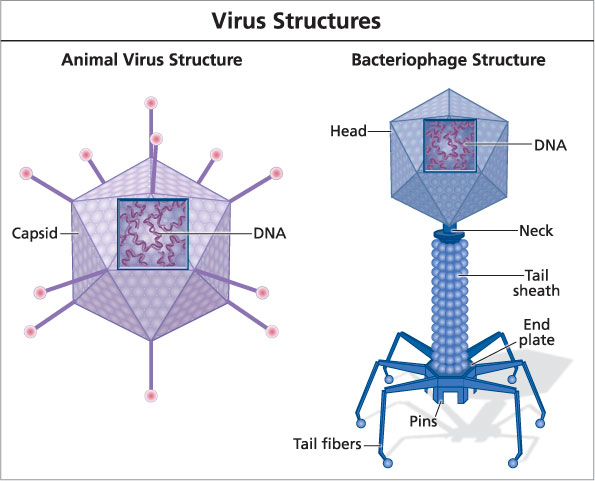
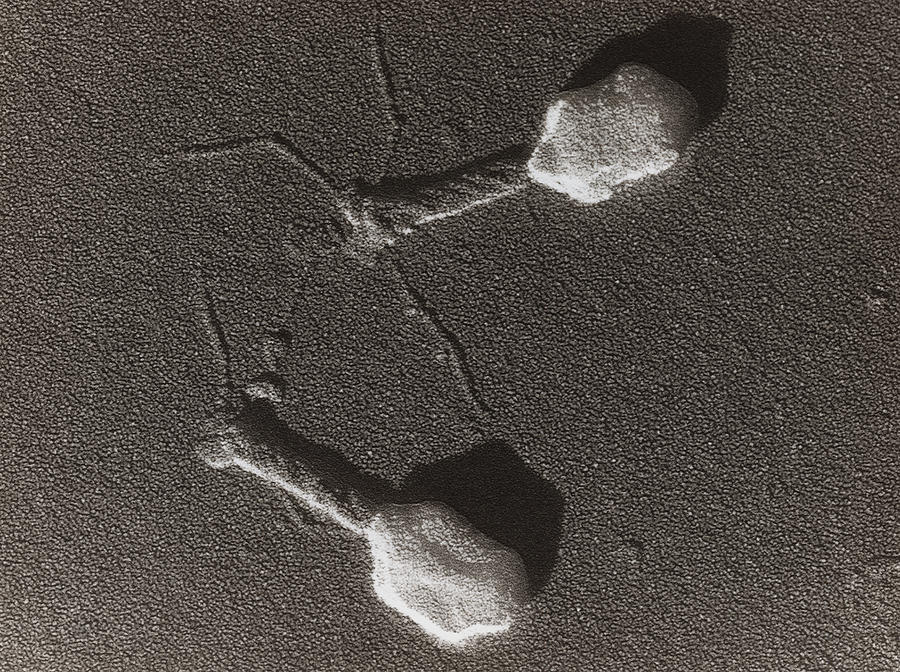
by Biology Teks
There are many different viruses (scientists believe that there may be millions), and although they can look quite different, they have some basic structural similarities. Basically, a virus has some form of genetic material surrounded by a protein shell called a capsid. Some viruses have additional structures such as elongated tails and fibres attached to the main capsid.
Viral Reproduction
One of the main reasons that viruses are considered non-living is the fact that they cannot reproduce on their own. They first need to infect a host cell and transfer their genetic material into the host cell’s genome in a process called transduction.(definition:The transfer of genetic material from one organism or virus to another organism.)
Once the viral genetic material is part of the host cell, the replication process of that cell will not only make new copies of itself, but copies of the virus, as well. Essentially, the virus hijacks the host cell and uses it to reproduce.
Viral Infectious Cycle
This video does a nice job of describing the infectious cycle of a virus. While you watch, pay particular attention to the differences between the lytic cycle(definition:A phase of the virus life cycle during which the virus replicates within the host cell, releasing a new generation of viruses when the infected cell lyses.) and the lysogenic cycle.(definition:A phase where the viral genetic material fuses with the host cell’s genetic material, allowing the virus genetic information to be replicated into the daughter cells.) Also, listen carefully to the information about the use of viruses as pesticides. Think about how this can have an impact on other organisms.
Living or Not?
As you can see, viruses are closely interconnected with other life forms. The fact that they have genetic material seems to be the bridge between living and nonliving. Remember, the idea of what is alive and what is not is based upon rules and conditions created by humans. In fact, some people do consider viruses to be another life form. What do you think?
What Does it All Mean?
Throughout this activity, you have learned about genetic diversity and how meiosis plays a large role in the variance that leads to this diversity. Events such as crossing over and independent assortment create random arrangements of the genes that are passed on to the gametes and ultimately, to a new individual.
CONSOLIDATION
Variance Leads to Diversity
Ultimately, the random variance resulting from the meiotic process is a major driver of diversity in populations. As you move through this unit, you will see how this variance allows for the evolution of a species and the diversity of life you learned about in the previous unit.
The random nature of crossing over and independent assortment can together create an almost unlimited number of combinations when dealing with all 46 chromosomes in the human genome. To make life a little easier for you, the number of chromosomes involved in the following task will be reduced. Even with only a few chromosomes involved, you will still find that the meiotic processes can create a surprising amount of variance.
That's So Random!
Crossing over in prophase I and independent assortment at metaphase I are the events that are responsible for the variation in the gametes produced during meiosis.
Starting with three pairs of paper homologous chromosomes (organisms such as the yellow fever mosquito and the Indian muntjac have only three pairs of chromosomes), you will simulate random crossing over and independent assortment events using the roll of a die and a flip of a coin. You will then share the resulting gametes with your classmates to see if any two are alike.
Similar Yet Different
In this activity, you were introduced to meiosis and the events that make it different from mitosis. Ultimately, each process is about creating new daughter cells from a parent cell, but the end result is quite different in each process.
Check your understanding of the two processes using the following interactive.
Which is Which?
For each statement below, determine if the event applies to mitosis, meiosis, or both by clicking the appropriate box. Repeat the exercise until you can complete the chart without making a mistake.
Comparison
Meiosis is a pretty impressive process! The ability to create gametes with a virtually limitless amount of variance is a main driver behind genetic diversity in populations. As you go through this unit, you will see how this diversity is a major player behind the evolution of a species. You will also gain a better understanding of how the different genes found in the gametes impact the traits of an organism. This is just starting to get good!