Interactions and Change
Reproduction on the Organism Level
MINDS ON
Remember, It's All in the Genes!
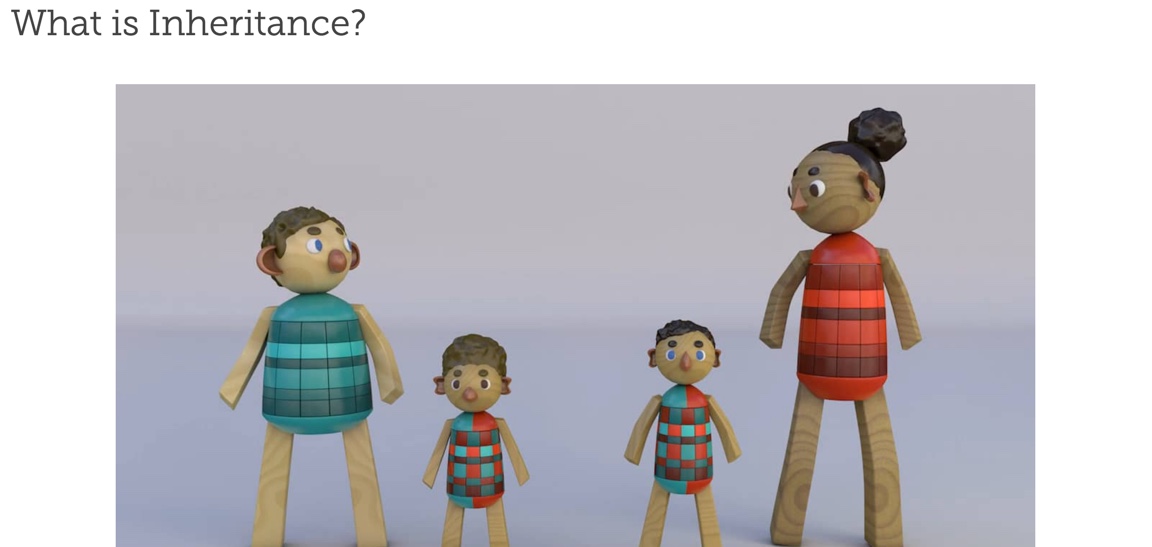
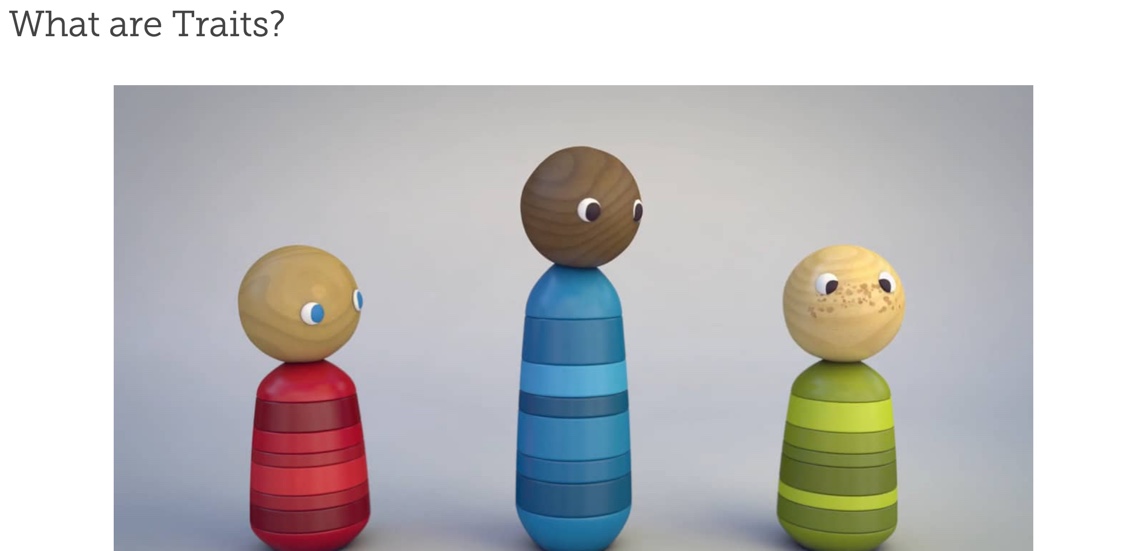
In the last activity, you looked at meiosis and how that process results in genetic variation due to crossing over. You also explored the randomness of independent assortment. This means that each gamete produced is genetically unique, and so different versions of genes, known as alleles,(definition:Any of several forms of a gene, usually arising through mutation, that are responsible for hereditary variation.) are passed on to the zygote upon fertilization. It is this variation in the genes, received through sexual reproduction, that gives offspring their traits. It is this passing on of traits, or inheritance(definition:The process of genetic transmission of characteristics from parent to offspring.) that you will explore in this activity. You will also look at how various genetic disorders are passed on from parent to offspring.
It is important that you understand the basics before we take a detailed look at how the transfer of genes makes us who we are. Take a look at these short videos from the Learn Genetics program at the University of Utah to learn more about inheritance and traits:
by Learn.Genetics
by Learn.Genetics
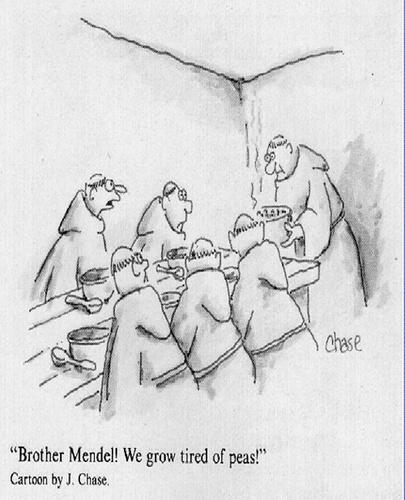
The Father of Genetics
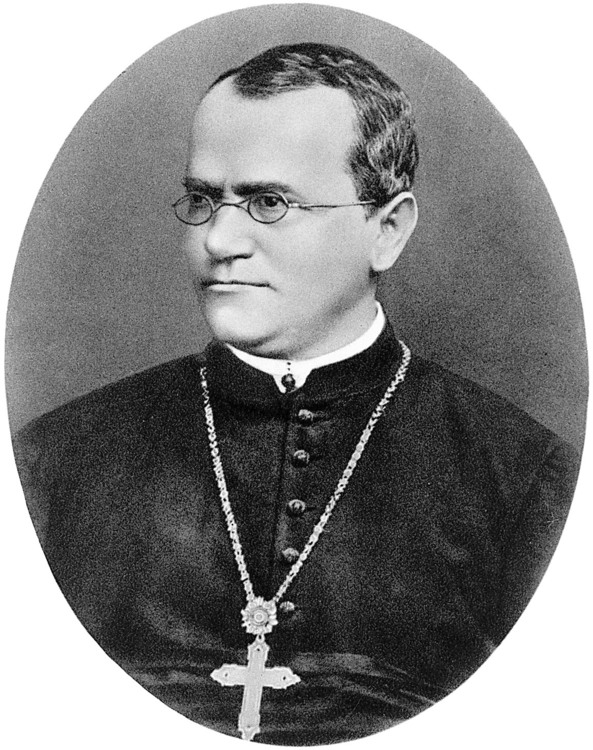
by Hugo Iltis - Wellcome Library, London used under CC BY
Most of the content within this activity will be based upon Mendelian inheritance.(definition:Inheritance that follows Mendel's theory of heredity.) Gregor Mendel was an Austrian monk and biologist whose observations and experiments with pea plants gave us the basic principles of heredity and set the foundation of modern genetics (I told you earlier that pea plants were special!). Mendel would crossbreed(definition:The process of producing offspring by mating two individuals that come from different breeds, varieties, or species.) pea plants with specific traits to see what traits would show up in the next generation.
Based on his work, Mendel came up with the following inheritance fundamentals (most of which you have already learned about in earlier activities):
- Inheritance involves the passing of genes from parents to offspring.
- The alleles that determine traits are separated into reproductive cells through meiosis and randomly reunite during fertilization.
- Genes located on different chromosomes will be inherited independently from each other.
Through his observations, Mendel produced his Law of Segregation. This law states that:
- organisms inherit two copies of each gene, one from each parent (remember the homologous genes from meiosis?); and
- organisms donate only one copy of each gene to their gametes (also due to the assortment that occurs in meiosis).
At the end of this activity, you will see that some inheritance does not follow the basic ideas presented above. This is classified as non-Mendelian inheritance.
The following video is a nice overview of the concepts you will investigate in the Action section. Don’t worry about keeping track of new terms at this point, as all the new information presented in the video will covered in detail throughout this activity.
You are now ready to wade into the gene pool to see what heredity is all about. Come on in, the water is fine!
ACTION
You Can Predict Future Generations!
Well, maybe not exactly, but there are ways to determine the probability(definition:The likelihood that a specific outcome will occur.) of certain traits and genetic disorders being passed onto the next generation by using the fundamentals of Mendelian inheritance. The higher the probability, the greater the chance that the trait will be seen in the offspring. Once the mechanism of inheritance was better understood, humans were able to manipulate those probabilities to produce populations of species with the most desirable traits, or prevent various genetic disorders from impacting the next generation.
By breeding individuals with preferred traits, we are able to increase the likelihood that those traits will show up in the next generation. For example, drought resistant crops and designer dogs that can be carried in a purse have been bred this way. Selective breeding(definition:The intentional breeding of organisms with a desirable trait in an attempt to produce offspring with similar desirable or improved traits.) has had a considerable impact on our way of life. It's here to stay.
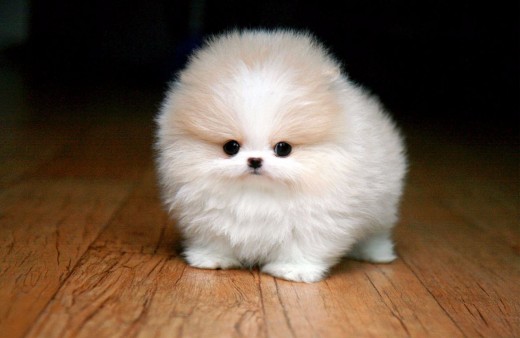
by pomskypup.com
As you move through the unit, you will see how human interactions with the genetic process, such as selective breeding, help to shape the world we live in...for better or for worse. You will also see how understanding inheritance patterns can help prevent genetic disorders from moving to the next generation.
The Lingo of Life
There will be a number of new terms presented in this activity. Many you have heard before, but you may not know their true definitions. You will need to learn these terms in order to understand inheritance fully. The fun never stops!
Let’s use the common genetic trait of tongue rolling to illustrate these definitions.
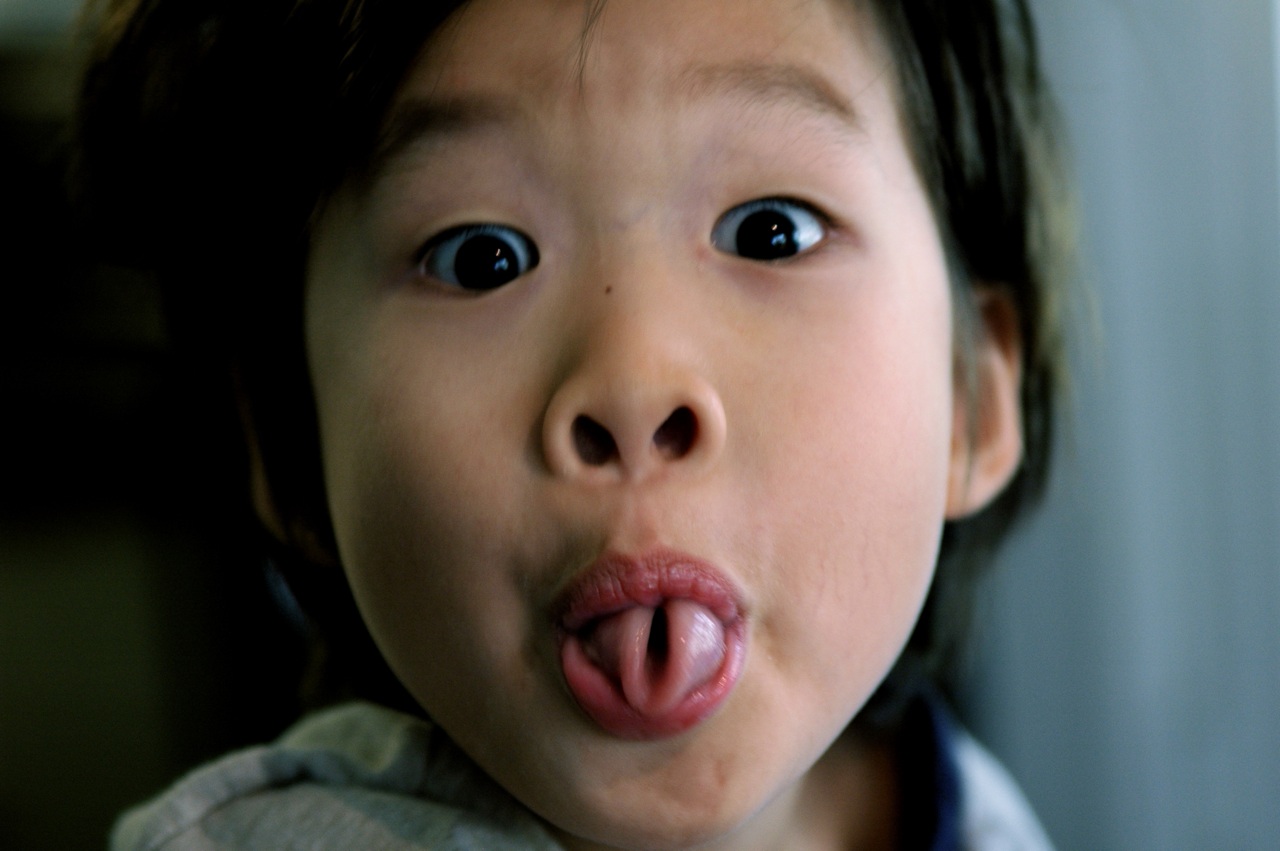
by Gideon Tsang from Austin, USA used under ShareAlike CC BY-SA
Biology and other branches of science often rely on simplifications of concepts in order to help students understand the basic principles behind them.
The genetic traits that we look at in this course are not always as cut and dried as they may appear to be. Many characteristics do have a genetic connection passed from parent to child, but these traits can also be influenced by other factors. Normally, your traits are a combination of genes and environmental factors.
For example, tongue rolling does indeed have a genetic connection, but people who are born without the ability to naturally roll their tongues can learn to do so if they repeatedly practice. Although the examples used may be oversimplified, please know that the main genetic ideas behind them are accurate. We just aren’t incorporating external factors such as this into the mix.
So, it isn’t lying if I TELL you that I am bending the truth a bit, right?
Back to Tongue Rolling!
As you know, you receive two alleles of each gene upon fertilization: one from each parent. Remember that alleles are different versions of the same gene. In this case, you can be given the ‘tongue rolling’ allele or the ‘non-tongue rolling’ allele from your parents.

by National Institutes of Health
It can be a bit of a pain to keep saying tongue rolling or non-tongue rolling, so letters are used to represent different alleles to simplify the language. We can represent the tongue rolling allele with ‘R’ and non-tongue rolling with ‘r.’ It is important to use the same letter for each possible allele of the same characteristic because we’re describing the same gene. You can choose the letter, but be sure to be consistent with your labelling. You will learn more about the letters and the information they represent soon.
Using these letters, we can represent both alleles that an individual has for a specific gene. Each letter represents one allele from each parent. So, an individual can be RR, Rr, or rr for the tongue rolling characteristic, depending on the combination of alleles passed on from the parents. This two-letter code is known as the genotype(definition:The genetic makeup of the individual.) for that characteristic.

If both parents pass on the R allele (genotype of RR), you would expect that the offspring would also be able to roll his/her tongue. When an individual receives the same allele from both parents, she/he is said to be homozygous(definition:When an individual carries two of the same alleles for a specific characteristic.) for that characteristic.
The same idea holds true if both parents passed on the allele that doesn’t result in the tongue rolling ability (genotype of rr). Since the same allele is present for that characteristic from both parents, that individual would be homozygous for that characteristic.
Although you cannot see the actual genotype of a characteristic, you can see or detect the outward expression of the characteristic. In this case, you can actually see if a person can roll her/his tongue or not. This observable expression of a characteristic is called the phenotype.(definition:The physical expression of a trait.)
Now, what if the genotype for that trait is Rr? In this case, the individual has one allele for tongue rolling and one allele for non-tongue rolling. When you have two different alleles for a characteristic, it is known as heterozygous.(definition:When an individual carries two different alleles for a specific trait.)
Challenge!
When an individual has the heterozygous genotype for a characteristic, what will the expressed phenotype be? Will it be a mixture of the two or will one win out?
In cases like this, the phenotype will be based on the dominant allele.(definition:The allele that, if present, is always expressed.) When an allele is dominant, that is the trait that will be expressed. Even if only one of the alleles for a characteristic is the dominant allele, you will see that trait come through. In the heterozygous condition, the non-dominant allele is called the recessive allele.(definition:The allele that is expressed only if no dominant allele is present.)
 Important!
Dominance doesn’t mean that the allele is the most plentiful in the population. Instead, it means that the allele dominates over or hides the recessive alleles. The dominant allele will always be expressed over a recessive allele.
How will you know which allele is dominant? This can only be determined based on experimentation and the observation of each trait. Since you most likely don’t have access to a genetics lab, the allele which is dominant and that which is recessive for a particular characteristic will be clearly stated in the examples and questions. When you are given the two letter genotype, the capital letter represents the dominant allele. In the case of the tongue rolling, the dominant allele is the ability to roll the tongue, so that allele will be R. The recessive allele is the r, or the inability to roll the tongue. When you have the homozygous condition, you need to state if the genotype is dominant or recessive. So, RR would be homozygous dominant for the tongue rolling characteristic. You do not need to specify which allele is dominant when an individual has the heterozygous condition, since you have one of each allele.
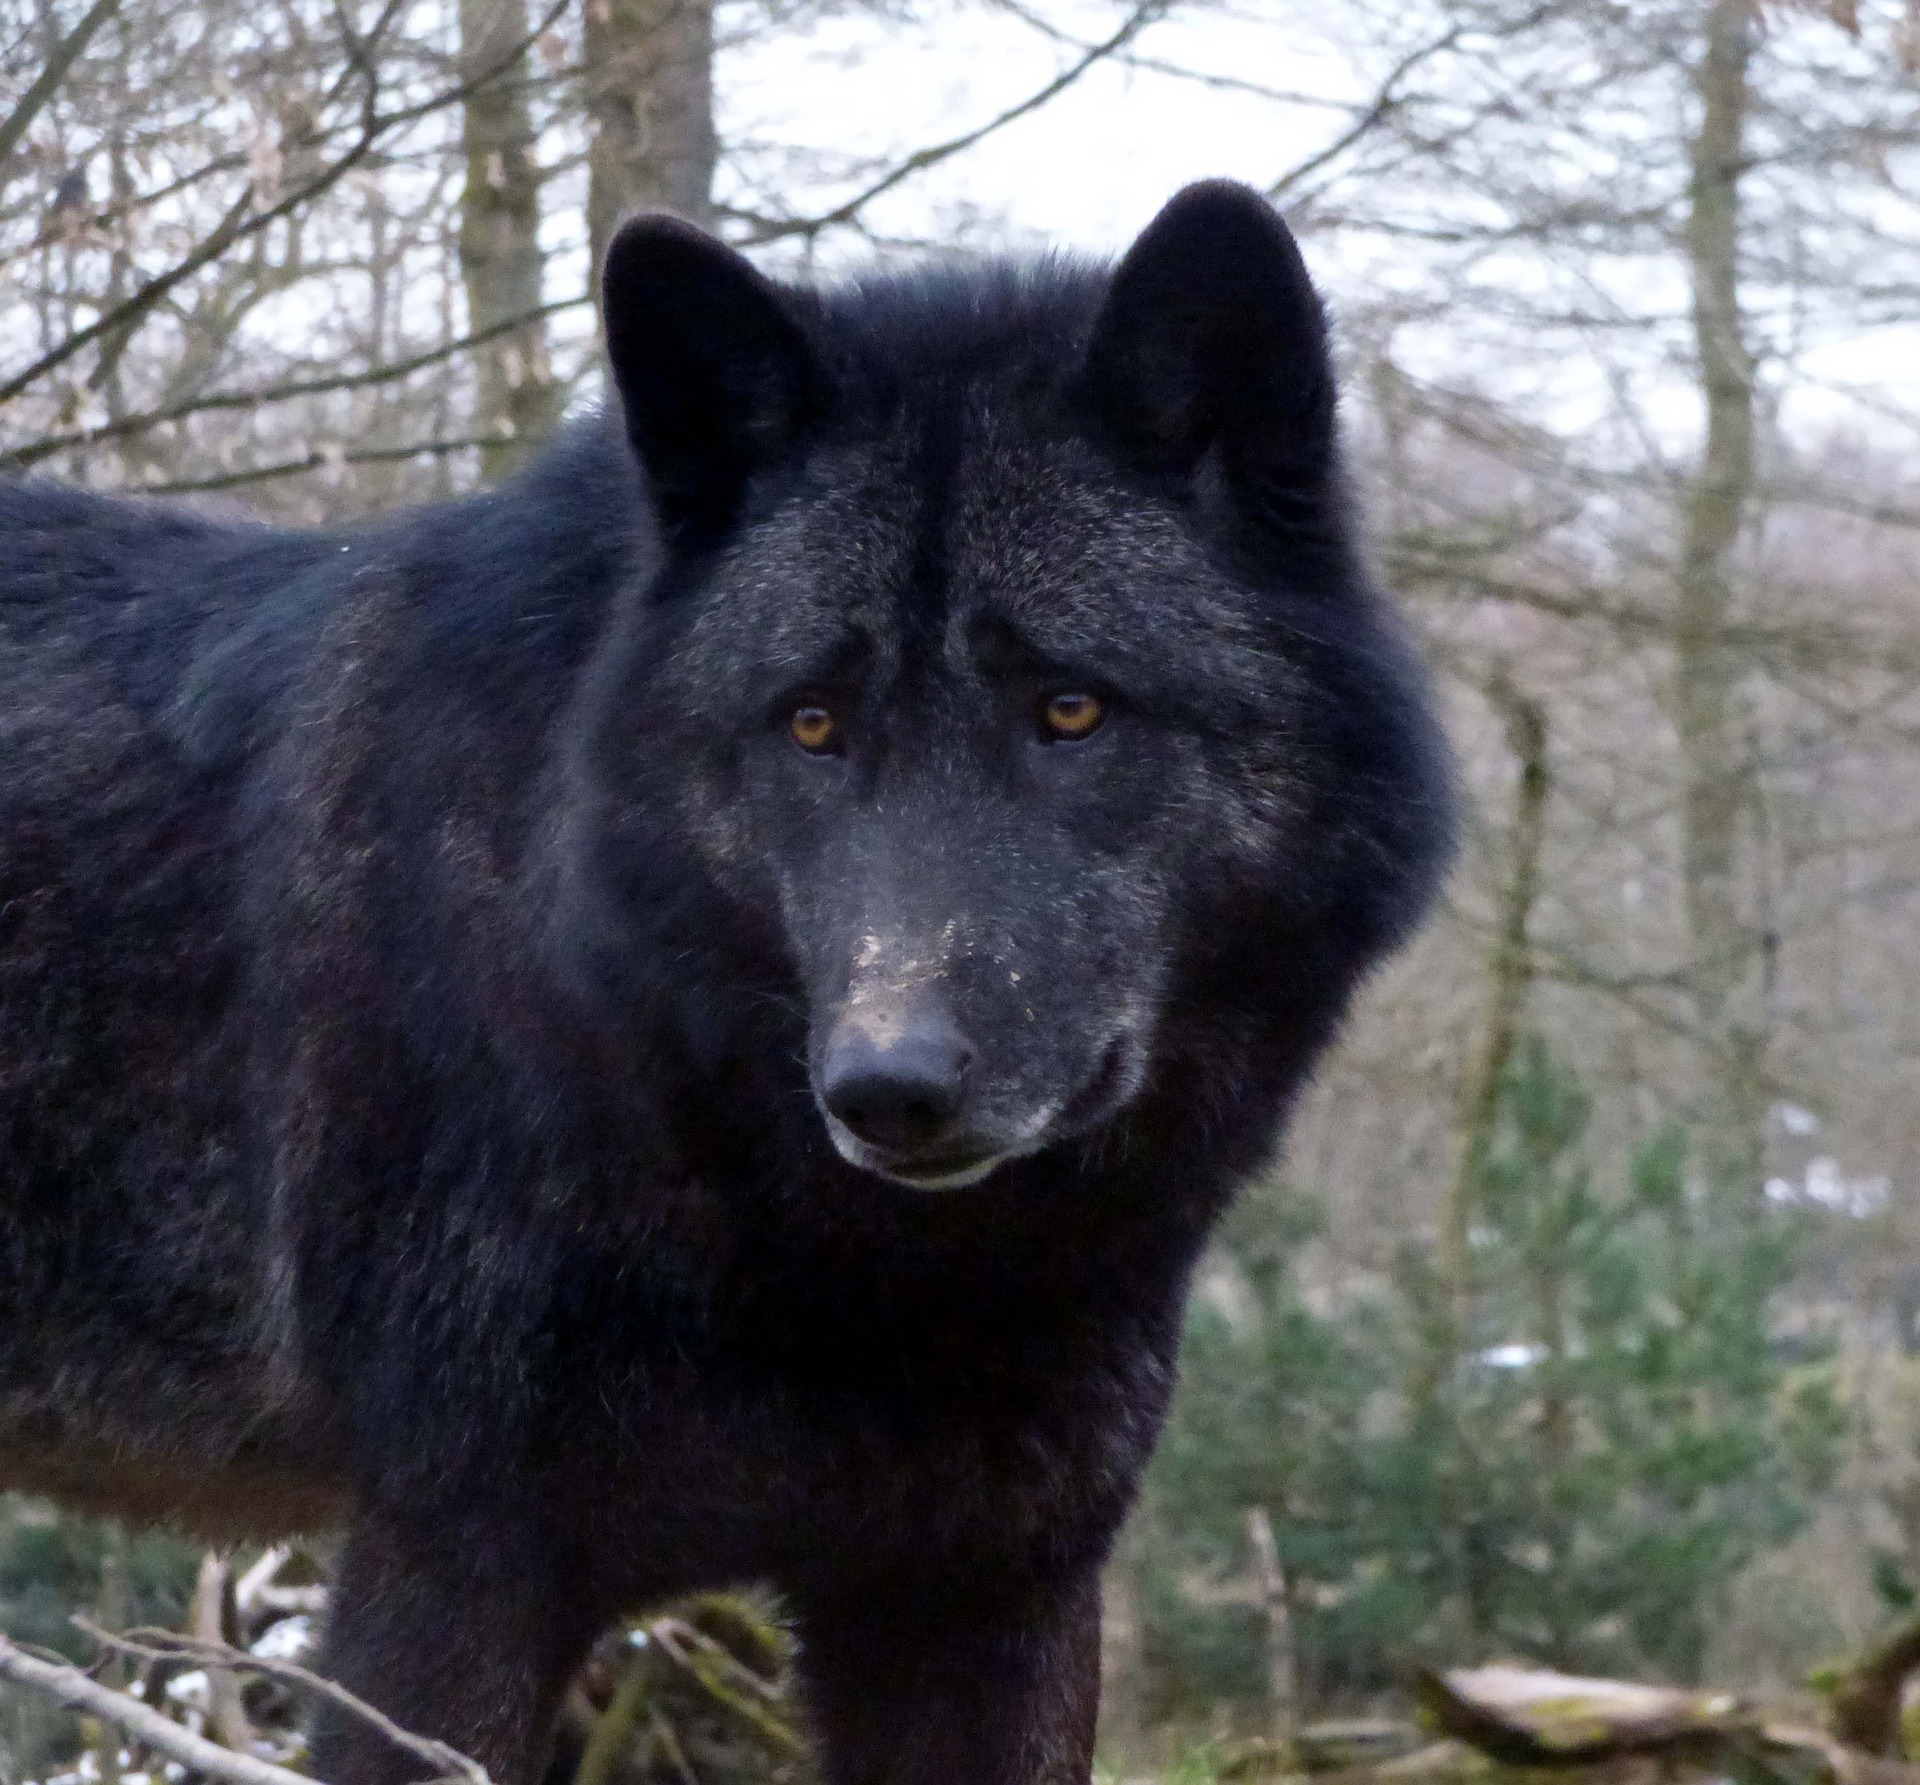
Remember to stay consistent with your letters, and base them on the dominant allele if possible. For example, say that white fur is dominant and black is recessive. It is the convention to take the expression of the dominant allele, and use that as the letter. Since white is dominant, the dominant allele will be W. Now, be careful! Many people then label the recessive allele as b for black. The use of a lowercase letter is correct since that allele is recessive, but you need to use the same letter. So, the recessive allele will be w, or the lowercase version of the dominant allele. This probably sounds confusing, but just be sure that the letter that represents a specific gene is the same for both the dominant and recessive alleles.
It is important to remember that although a certain trait is expressed, an individual may still be able to pass on the recessive allele to the next generation. This occurs with the heterozygous condition. If the genotype is Rr, the dominant R allele will be expressed, but there is still the recessive allele r in that genotype. During meiosis, some gametes will receive the R allele, while others will receive the r allele. This explains why it is possible for a son or daughter to have a trait that is not expressed in either parent or for traits that appear to skip a generation. This will become clearer as we move on through the activity.
Genotype and Phenotype
Continuing with tongue rolling, here are all the genotypes and associated phenotypes possible for that characteristic:

Whew! That was a good amount of terminology so far! Using good independent work(definition:I am able to independently check my understanding of genetic characteristics by answering the supplied questions.) skills, check your understanding of the terms by answering the following questions about genetic characteristics. If you have any trouble, be sure to go back and review the concepts.
 Genotype and Phenotype Questions
- A man has hair on his knuckles. Is this describing a genotype or a phenotype?
AnswerPhenotype, since the outward expression of the trait is described.
- Straight hair is recessive to curly hair. Based on the labelling convention of alleles, how would you represent the dominant allele?
AnswerC. Since curly hair is dominant, the first letter of curly is used and it is written in uppercase.
- An individual’s genotype for cheek type (dimpled or flat) is Dd. Which condition is recessive?
AnswerFlat cheeks. Since the letter used is D, dimples must be dominant over flat.
- In the question above, is the individual heterozygous or homozygous for the trait?
AnswerHeterozygous, as there are two different alleles in the genotype.
- An individual is homozygous recessive for tongue rolling. Rolling is dominant. What is the person’s genotype?
Answerrr. Homozygous means that both alleles are the same, and recessive means that the lowercase letter will be used.
Finding Probabilities: Monohybrid Crosses
Now that you have a good understanding of genotypes and phenotypes, you can use this information to find the probability of a trait being expressed in the next generation. You know what would make this interesting? More terminology!
To find how specific traits were inherited, Mendel had to perform MANY crosses(definition:Mating of two organisms from distinct genetic traits.) of true breeding(definition:Organisms that always pass down the same trait to their offspring.) pea plants, which were homozygous for the trait being studied. He would start with two plants that differed in only one characteristic such as flower colour, seed colour, seed shape, or flower position. He called these parent plants the P generation.(definition:The parent plants used in a cross.)
Mendel would cross pollinate the plants so that they would produce seeds. He would first remove the stamens(definition:The male fertilizing organ of a flower.) from the receiving plant in order to prevent self-pollination.
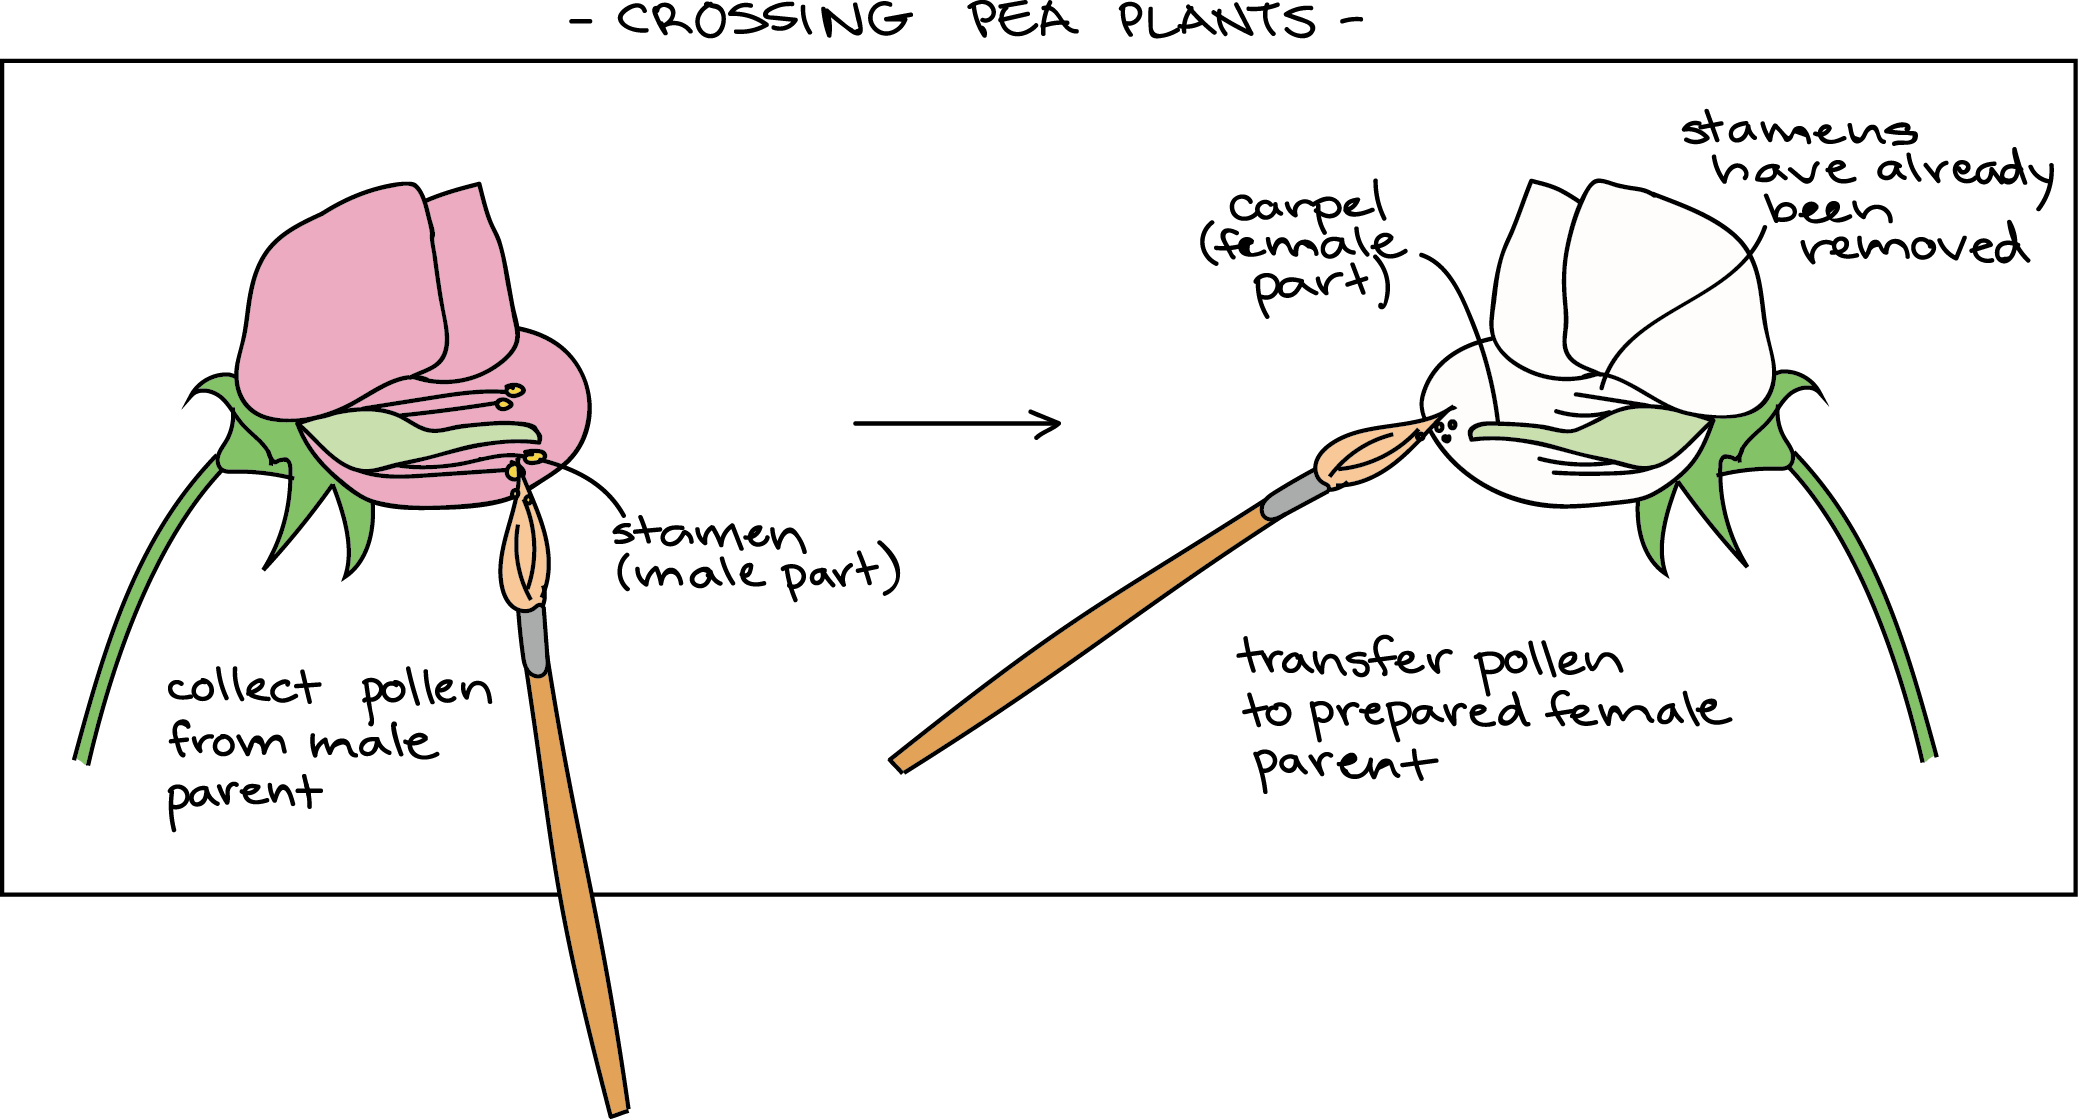
The offspring of these fertilizations were hybrids(definition:The offspring of true-breeding plants.) of the two parent plants and were called the filial or F1 generation.(definition:The offspring resulting from the cross of P generation plants.) The ‘F’ from the F1 generation comes from the Latin word filius, which means ‘son.’ Mendel would then plant the seeds produced, wait for the F1 generation to mature. Then he would make observations of the phenotypes of the characteristic being studied. Thank goodness that pea plants grow quickly!
From there, he would then cross plants from the F1 generation to produce the F2 generation, and on and on...
These experiments are known as monohybrid crosses,(definition:Breeding of organisms that differ in a single given trait.) since the P generation plants differed only in one specific trait.
You can go back to the end of the Minds On section for the video about Mendel’s pea plants for a review of his work if needed.
Be There or Be Square!
As mentioned, Mendel performed an incredible number of crosses to study inheritance. From his data, he was able to determine probabilities of the different phenotypes possible from a monohybrid cross. Thankfully, you won’t need to spend years in the garden to determine these probabilities!
A Punnett square(definition:A diagram that is used to predict the genotypes of a particular cross or breeding experiment.) is a diagram used to predict all the possible phenotypes from a cross quickly and easily. This tool is named after Reginald C. Punnett, an English geneticist, who used the square to track genetic combinations while he worked.
How Do Punnett Squares Work?
As mentioned, Punnett squares are quite simple to use. You already know that for offspring to be produced, a gamete from each parent must join together to form a zygote. So, in order to make predictions about the potential offspring, you need to have some information about the gametes that are passed on. The nice thing is that this is easy to determine, as well.
Let’s look at an example. In pea plants, a yellow seed is dominant over a green seed.
Challenge!
If yellow seeds are dominant over green seeds, what are all the possible genotypes and associated phenotypes?
Answer
Since yellow is dominant, we will represent this allele with an uppercase Y. This means that the green, recessive allele is the lowercase y. The possible genotypes and phenotypes are therefore:
YY = yellow seed
Yy = yellow seed
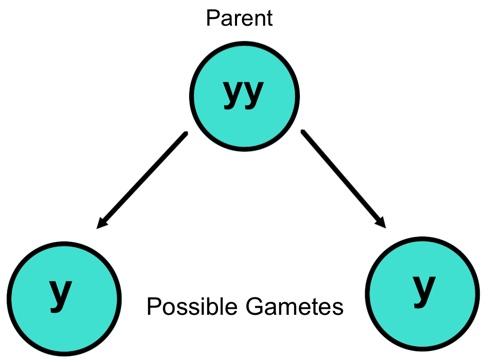
yy = green seed
One of the parent plants produces green seeds, so it must be homozygous recessive, yy. During meiosis, each gamete receives only one of the homologous alleles. In this case, the recessive allele is the only allele present, so the only possible allele that each gamete can have is y.
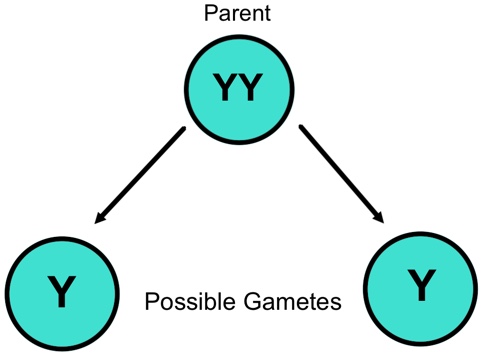
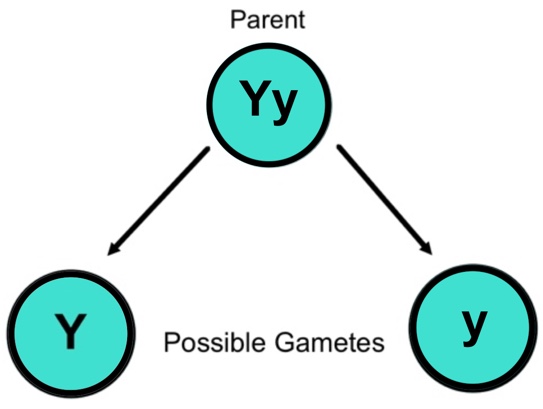
The other parent plant produces yellow seeds. This means the genotype can be homozygous dominant, YY, or heterozygous, Yy. Since Y is dominant, each case results in yellow seeds.
If the plant has the YY genotype, all gametes would receive a Y, as that is all that is available. If the plant had the Yy genotype, then there are two possibilities: either a Y or a y.
Filling in the Square
In our example, let’s say that one parent is recessive and produces green seeds, and the other parent is homozygous dominant and produces yellow seeds.
The parental cross can be represented as follows, with the ‘x’ in the centre meaning ‘cross with.’

Remember that we have already determined that the possible gametes for the first parent are y and y, and Y and Y for the second parent.
Since this is a monohybrid cross, there are only two possible gametes for each parent. This means we need a 2 x 2 Punnett square. The gametes of one parent are written across the top of the square, and the gametes from the other parent are written down the side of the square.

The next step is to perform the cross. Use the following interactive to see the possible offspring from the YY x yy cross.
Type the gametes from the YY parent along the top of the Punnett square and the gametes from the yy parent along the side to see the possible offspring genotypes.
Punnett
It is important to understand that each square does not represent an individual offspring. Instead, each square represents one possible genotype that an offspring can inherit. Since there are four squares, each genotype has a probability of ¼ or 25%.
As you can see, the result of each cross is the genotype Yy, which results in the yellow seed phenotype (since Y is the dominant yellow allele). This means that the probability of producing an offspring with yellow seeds is 4/4 or 100%. There is only one possible outcome from this cross.
It is important to remember that these are only predictions that are based on probabilities. This time, you have only one possible outcome, but you will see that this is not always the case. Use the interactive above to try different gamete combinations to see the possible offspring genotypes that can result.
Before you try it yourself in the next section, make sure you are comfortable with the concepts.
You Try It!
As long as you can determine the gametes produced by each parent, you can use the Punnett square to predict the outcome of a monohybrid cross. Now it is time for you to try an example.
 Example
For the flower colour of a pea plant, purple is dominant over white. If you cross two parent plants, each with a heterozygous genotype for this characteristic, determine the possible genotypes and associated phenotypes of the F1 generation.
Once you attempt this question, watch the following video about Punnett squares and you will see the answer for this example. Be sure to try it on your own first! You can complete the Punnett square in a number of ways. You can draw it out on paper, use the interactive above, or use an online Punnett square calculator.
How did you do? The genotypic ratio produced by that Punnett square is 1PP : 2 Pp : 1 pp, and the phenotypic ratio is 3 Purple : 1 White. The genotypic and phenotypic ratios are different, since two of the genotypes in the F1 generation result in the same phenotype. Both PP and Pp genotypes produce purple flowers.
Again, these values are only probabilities. If you did this monohybrid cross for real, you would have a ¼ or 25% chance of producing a white flower. Also, each offspring is independent of each other. So, if you ended up with three plants with purple flowers, there is still only a 25% chance that the fourth flower in the F1 generation will be white. Remember, these numbers represent the likelihood of that result and are not written in stone.
The Glencoe Online Learning Center has a number of Punnett square questions for you to attempt. Use good responsibility(definition:I am able to complete the practice Punnett square questions and monitor my own progress.) skills and be sure to check your answers at the end.
Extra Help
If you would like some additional practice or need another explanation of monohybrid Punnett squares, use your good independent work(definition:I am able to seek additional resources to help with my understanding of inheritance rules.) skills and take some time to watch this video. Not only does it go over the use of the squares, but it provides a review of the terminology that you learned so far in this activity.
Stepping it Up: Dihybrid Crosses
Come on, you didn’t think you would get through this THAT easily, did you? Actually, dihybrid crosses(definition:Breeding of organisms that differ in two traits.) are essentially done the same way as monohybrid crosses, but you need a bigger Punnett square.
Since monohybrid crosses deal with one characteristic, dihybrid must deal with two characteristics at the same time, since ‘di’ means two. The only trick here is to find the gametes produced by each parent. The rest is exactly the same as with monohybrid crosses.
Example
The best way to learn this is through example. In the monohybrid cross, you looked at seed colour. Let’s add flower colour to the mix.
Seed Colour - Yellow seed allele is dominant and green seed allele is recessive.
The possible genotypes and phenotypes for this single trait are therefore:
YY = yellow seed
Yy = yellow seed
yy = green seed
Flower Colour - Purple flower allele is dominant and the white flower allele is recessive.
The possible genotypes and phenotypes for this single trait are therefore:
PP = purple flower
Pp = purple flower
pp = white flower
Each characteristic has three possible genotypes. When dealing with dihybrid crosses, each parent plant will have one combination from each characteristic.
For example, one parent plant can have a genotype of YYPP. As you can see, each characteristic is represented. This plant would make yellow seeds and have purple flowers. Another parent plant may have the genotype of YyPp. Again, both characteristics are included in the genotype. Here, the plant would also make yellow seeds and have purple flowers as these are the dominant alleles.
Two Trait Question
For a dihybrid cross dealing with seed colour and flower colour, what are all the possible parent plant genotypes? Be sure to include the two already mentioned above.
Answer
YYPP, YYPp, YYpp, YyPP, YyPp, Yypp, yyPP, yyPp, yypp. There are nine different P generation genotypes possible when dealing with a dihybrid cross.
Were you able to determine all of the possible P generation genotypes? Good stuff!
Determining Gametes for Dihybrid Crosses
Just as in monohybrid crosses, you need to know the gametes produced by the given parent plants. This seems to be the place where students have the most trouble, so be careful!
Let’s take one of the parent plants from above: YyPp. This parent plant is heterozygous for both traits. We now need to determine the possible gametes produced to use the Punnett square. Each possible gamete will have one of the two letters from each trait (since the parent passes on one allele from each homologous pair to each gamete).
Remember the FOIL method for expanding two binomials in algebra? Well, that same method can be used to determine possible gametes. Remember all the people in your math class asking, ‘When will we ever use this?’ Well, now they have their answer!
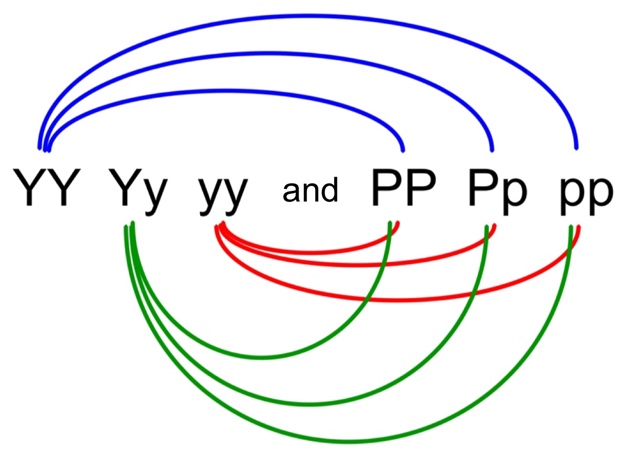
Just think of each trait as a binomial. So, for our genotype of YyPp, you can think of it as (Y y) (P p).
- Take the First allele from each trait: YP. That is the first possible gamete!
- Now take the Outside allele from each trait: Yp. That is another possible gamete.
- Next take the Inside allele from each trait: yP. You guessed it! That is the next possible gamete.
- Finally, take the Last allele in each trait: yp.
There you have it! For the parent plant YyPp, the possible gametes are YP, Yp, yP, and yp.
If you use this method every time, you will never miss any of the possible gametes. Take a look at the animation below to see another example. In this case, it shows the gametes for each parent at the same time. Remember, HhSs x hhss means that the parent HhSs is being crossed with the parent hhss.
Now that you know how to determine the possible gametes, it is time to do an actual dihybrid cross.
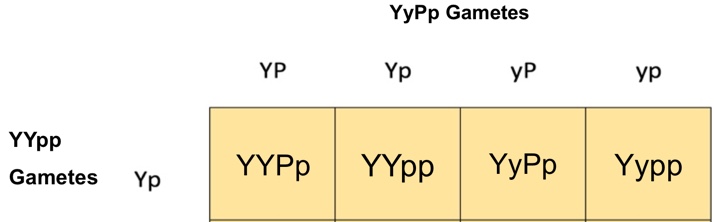
Dihybrid Punnett Squares
Your task is to determine all the possible genotypes and phenotypes of the F1 generation from the cross of two pea plants. The two characteristics being studied are seed colour and flower colour.
One parent is heterozygous for both traits, while the other is homozygous dominant for seed colour and recessive for flower colour:
YyPp x YYpp
Using the FOIL method, determine the possible gametes from each parent:
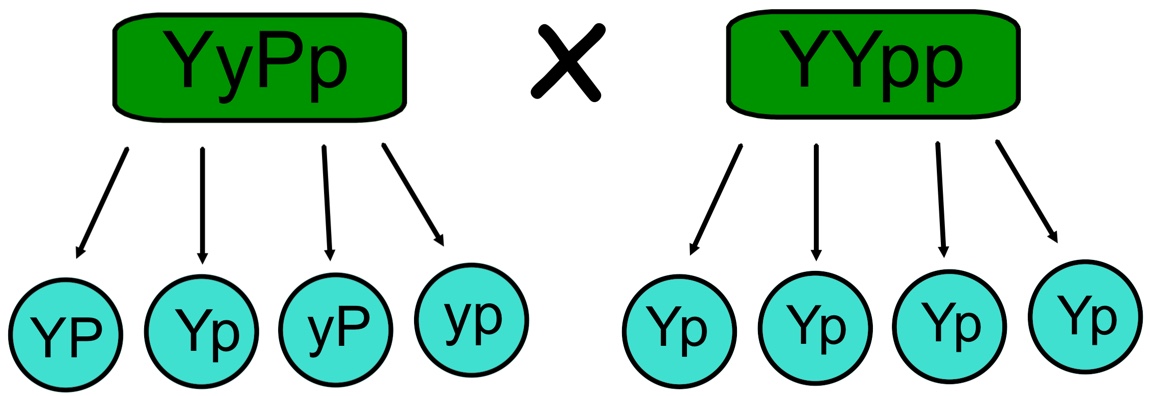
Since you have four possible gametes from each parent, the Punnett square must be 4 x 4. Fill in the gametes across the top and along the side the same way you did with the monohybrid cross:

The next step is to do the cross and fill each each cell of the Punnett square:

Important Note!
When writing a genotype, it is the convention to write the dominant allele first. So, instead of having a genotype written as yYpP, it would instead be written as YpPp. In each case, the dominant allele is written first. Changing the order does not change the phenotype.
Finally, you can calculate the ratios of the genotypes and phenotypes.
The genotypic ratio(definition:Describes the number of times a genotype appears in a Punnett square cross.) is:
4 YYPp : 4 YYpp : 4 YyPp : 4 Yypp
Just as in math, you want to find the lowest whole number ratio:
1 YYPp : 1 YYpp : 1 YyPp : 1 Yypp
In terms of probability, each genotype has a ¼ or 25% chance of being produced in the cross.
Now you can find the phenotypic ratio.(definition:Describes the number of times a phenotype appears in a Punnett square.) Remember, this ratio may not be the same as the genotypic ratio since different genotypes can express the same phenotype.
1 YYPp = yellow seed, purple flower
1 YYpp = yellow seed, white flower
1 YyPp = yellow seed, purple flower
1 Yypp = yellow seed, white flower
As you can see, there are only two possible phenotypes from this cross. This makes the phenotypic ratio:
2 yellow seed, purple flower : 2 yellow seed, white flower
In the lowest whole number ratio:
1 yellow seed, purple flower : 1 yellow seed, white flower
In terms of probability, each phenotype has a ½ or 50% chance of being produced in the cross.
Time Saver!
Keeping track of all 16 squares from a dihybrid cross can be time consuming, but sometimes you can reduce the number of squares. Take a look at the dihybrid Punnett square you completed earlier:
Notice that each gamete along the left side has the same Yp alleles. If you look closely at the table, you will see that each row is exactly the same! So, whenever you have the same gamete, you will produce the same results within the table.
To save time, you may leave out any repeats of gametes for a parent. If you eliminate the repeats, your square will look like this:
Eliminating the repeats does not change the ratio. When you used the entire Punnett square with all 16 possibilities, the ratios were reduced to the lowest whole-number ratio to give you a genotypic ratio of 1 YYPp : 1 YYpp : 1 YyPp : 1 Yypp and a phenotypic ratio of 1 yellow seed, purple flower : 1 yellow seed, white flower.
As you can see from the reduced table, you retain the same ratios!
You Try it!
Now it’s time to try one of these dihybrid crosses on your own.
 Practice
Another characteristic in pea plants is seed shape. The dominant trait is round seeds, and the recessive trait is wrinkled seeds. Your task is to determine the genotypic and phenotypic ratios of a cross between two parent plants that are heterozygous for seed shape and seed colour (remember that a yellow seed allele is dominant over a green seed allele). Determine your ratios then compare yours to the correct answer.
Watch the following video to go over the process of a dihybrid cross and check your answers.
Were you able to come up with the proper ratios? If not, check to make sure you have the correct gametes for each parent. If you are having trouble, be sure to review the concepts and take another shot at it.
Extra Help
If you would like some additional practice or need another explanation of dihybrid cross Punnett squares, take some time to watch this video. Not only does it go over the use of the squares, but it provides a review of the terminology and concepts of a dihybrid cross.
It is very important that you have a good grasp of the dihybrid crosses before moving on. Sometimes it takes practice, but have faith in yourself! To test your understanding, try out this self-check quiz. Be sure to go over any questions that you are struggling with before moving onto the next section.
Non-Mendelian Inheritance
Wouldn’t it nice if all inheritance followed the rules that you just went over in the mono and dihybrid crosses? Just when you get comfortable with something, biology likes to throw a wrench into the works!
The crosses you completed earlier were all based on the idea of complete dominance(definition:The dominant allele always determines the phenotype.), but not all inheritance follows this rule. Also, these rules assume that there is no crossing over of homologous chromosomes in meiosis I. Crossing over can change the combination of alleles found in each gamete.
In fact, Mendel was quite lucky in his choice of plants and traits to study. Often the passing on of genes is much more complicated due to other factors. If he chose a different plant in his garden other than the pea, it may have been many more years until we had any understanding of inheritance at all! Each trait has now been mapped to specific chromosomes in the pea genome. We now know that the genes he studied were far apart on chromosomes. If they were closer together, crossing over of chromosomes in prophase I would have changed the ratios of offspring with different traits.
Incomplete dominance,(definition:When the dominant allele does not completely mask the recessive allele and blending occurs.) codominance,(definition:When two alleles for a trait are equally expressed with neither being dominant or recessive. No blending occurs.) and multiple alleles(definition:When there are three or more alleles of the same gene, but only two can be present in a single organism.) will all be looked at in detail.
The following video will give you an overview on these and other forms of non-Mendelian inheritance:
The main forms of non-Mendelian inheritance mentioned in the video are detailed below. Each type of inheritance, whether it be Mendelian or not, is dealt with in a different manner when looking for probabilities. This is why it is very important to know the type of inheritance you are dealing with prior to attempting to apply a Punnett square in order to predict inheritance later on.
Incomplete Dominance
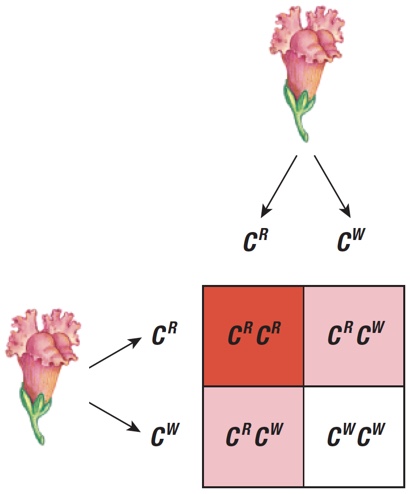
For this form of inheritance, the dominant allele does not completely mask the recessive allele. Instead, there is a blending of the two traits. The colour of a snapdragon flower is a classic example of incomplete dominance, and this type of inheritance is quite common in nature, especially in plants.
The most common form of notation for incomplete dominance is the superscript format. From the Punnett square you can see that C represents the colour characteristic, and the superscript represents the allele. CR represents the red allele and CW represents the white allele.
When the two alleles are present, the red and white alleles are blended to create a pink flower.
Codominance
Codominance is similar to incomplete dominance, only instead of blending the alleles, both traits appear at the same time.
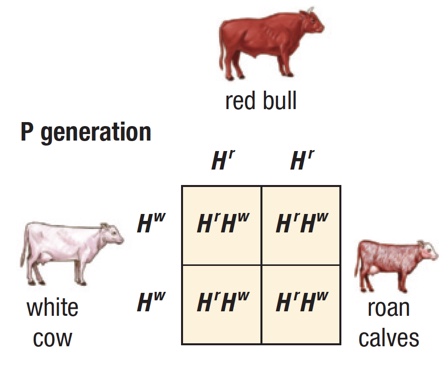
Shorthorn cattle show this codominant inheritance in their hair colour. Again, the superscript notation is commonly used to represent the alleles. The H represents the characteristic of hair colour, while the Hr represents the red allele and the Hw represents the white allele.
When both alleles are together in the genotype, both red and white hair can be found on the offspring. This colour combination is called roan, and consists of pure white hair intermingled with pure red hair as compared to blending into a pink colour.
Multiple Alleles
In some cases, there are more than two variations of a gene. Human blood types are one example of this. Blood type determination also has codominant and dominant aspects to it, so it can become quite complicated! This video does a nice job of going over the basic ideas of blood types.
Sex-Linked Inheritance
In the last activity, you learned that the human genome(definition:The genetic material of an organism including all of the genes.) consists of 23 pairs of chromosomes. Twenty-two of these pairs are autosomes, while the 23rd pair is the sex chromosomes X or Y. Females have the XX configuration, while males have the XY configuration.
All of the inheritance you have looked at in this activity has been autosomal inheritance.(definition:Inheritance of alleles located on the autosomal or non-sex chromosomes.) When the alleles are located on the X or Y chromosome, the inheritance is known as sex-linked(definition:When alleles found on one of the sex chromosomes are passed on.) inheritance.
Take a look at the following video to explore the concepts behind sex-linked inheritance.
Although some sex-linked traits are related to the Y chromosome, the majority are related to the X chromosome, so often you will hear the term X-linked(definition:Expression of an allele found on the X chromosome.) instead of sex-linked.
Unfortunately, in humans, most of the alleles that are X-linked cause genetic disorders. Due to this, male offspring are the most impacted by these disorders. If a female receives an X-chromosome with a recessive allele for the disorder, the second copy of the X chromosome can mask the effects of that allele. It is like the second X chromosome is a backup copy. Males however, are XY and do not have a second X chromosome to compensate.
Females can inherit a recessive X-linked disorder, but only if the X chromosome from both the mother and father have the allele. The probability of this happening is very low. If a female does have the disorder allele on one of the X chromosomes, she is known as a carrier(definition:An organism that has inherited a recessive allele for a genetic trait but does not express that trait.) and can pass on the allele to her offspring. In some cases, a carrier can show muted symptoms of the disorder.
Traits that can be passed on through X-linked inheritance include male-pattern baldness, certain forms of colour blindness, and hemophilia.(definition:A medical condition where the blood's’ ability to clot is severely reduced.) Hemophilia will be the focus in the example below.
Superscript notation is normally used to represent the genotype of sex-linked alleles. Since hemophilia is a recessive disorder, it is represented by a lowercase h. XH is a normal X chromosome, while Xh represents the allele that causes hemophilia.
When a female carrier mates with a male that does not have hemophilia, the following probabilities are the result:

There is a 2/4 or 50% chance that the offspring will not have inherited the hemophilia gene at all (XHXH and XHY). There is a ¼ or 25% chance of having a female offspring who is a carrier of the hemophilia allele (XHXh). Finally, there is a ¼ or 25% chance that the couple will produce a male who has hemophilia.
This means that any male child that the couple produces will have a 50% chance of inheriting the disease.
Y-Linked Disorders
The Y sex-chromosome is smaller than the X sex-chromosome, and therefore carries fewer genes. This is the main reason that there are more X-linked disorders. There are however, some Y-linked disorders that can be passed from father to son. Most of the Y-linked disorders impact the male's fertility, such as azoospermia, which is a complete inability to produce sperm. In most cases the father does not have the disorder, but gene mutation can occur during sperm formation and this mutated gene is then passed on to the son.
Heredity Theater
Even in the simplified version, you can see that inheritance is a complex process with a variety of factors that come into play. If you are looking for an overview of Mendelian and non-Mendelian-inheritance, take a look at the videos in the Heredity Theater below. The video about the Secrets of the X-Chromosome is very interesting!
The ability to predict the probability of an offspring inheriting a desirable trait or a genetic disorder can be very useful. Farmers can select the best breeding stock from their herds or crops, and try to produce a new generation of organisms that produce better or more milk, can resist pests or drought, or express any other desirable trait that can increase profits.
Humans have been manipulating breeding patterns well before Mendel, but the biological discoveries that he helped develop have made this genetic manipulation a true science.
Challenge!
Manipulation of breeding procedures have helped develop some very desirable traits in animals and plants. Breeders use the concepts of genetics we have seen here to cross organisms with desirable traits. Wild plants have been made to produce higher, more consistent yields, and everyone loves the almost limitless varieties of domesticated dogs that are available for adoption!
But does this selective breeding come with a price? Think about how human interactions with inheritance and manipulation of traits can impact biodiversity. If there is a price, is it worth the gains?
Punnett Practice
You have now been introduced to a variety of inheritance methods. For each type, the genotypic and phenotypic ratios can be determined using a Punnett square.
There are a number of online Punnett calculators out there, including the various types listed by bugaco.com. The calculators can save you time when doing crosses, but you will still need to be sure that the gametes you input are correct. Remember...garbage in, garbage out! Using the old fashioned pencil and paper method is also a good way to go.
It is important to note that different forms of inheritance will require different methods and notation to solve, so be sure to pay attention to the type of inheritance being asked about.
Here we go!
Practice
- Albinism (lack of pigment) is caused by a recessive allele in humans. If normal parents have an albino child, what is the probability that their next child will be normal for pigment?
- Assume brown eyes are dominant over blue eyes. A brown-eyed man marries a blue eyed woman. Explain how the genotype of the man can be determined.
- A man with blue eyes mates with a woman heterozygous for brown eyes. What is the probability of them having a blue eyed child? Remember that brown is dominant over blue eyes.
- Assume that white is dominant over black wool. Two white sheep produce a black offspring. What must the parents’ genotype for colour be? What is the probability that the next offspring will be black?
- Straight wings are dominant over curly wings in fruit flies. What is the probability of a straight winged offspring from the mating of a female with curly wings and a male that is heterozygous?
- Red fruit is dominant to yellow fruit in tomatoes. Tallness is dominant to shortness in these plants as well. What phenotypic and genotypic ratios would you predict for the offspring of parent plants; one of which is homozygous red and homozygous short while the other is heterozygous red and tall?
- In guinea pigs, black coat is due to a dominant gene while white is recessive. Short hair is dominant to long hair. A guinea pig which is heterozygous for black coat and short hair is crossed with a guinea pig which is homozygous recessive for both traits. Predict the outcome of the F1 generation.
- Pea plants that are heterozygous for both stem length (Tt) (T = tall and t = short) and pod shape (Rr) (R = round and r = wrinkled) are crossed with each other. What are the phenotypes of these parents? State the phenotypes of the parents. What are the possible phenotypes of their offspring? Give the probability of each phenotype.
- White carnations are crossed with red carnations. Both white and red alleles show incomplete dominance. Give the genotype of the parent flowers and the genotype and phenotype of the offspring.
- In a cross between a white-eyed female fruit fly and red-eyed male, what percent of the female offspring will have white eyes? (White eyes are X- linked, recessive).
- Albinism (lack of pigment) is caused by a recessive allele in humans. If normal parents have an albino child, what is the probability that their next child will be normal for pigment?
The birth of every child is a separate event. Every time a child is born, there would be a 1 in 4 chance of that child being albino. The probability of the next child will also be ¼. Therefore there is a 75% chance that the next child will have normal pigmentation.
- Assume brown eyes are dominant over blue eyes. A brown-eyed man marries a blue eyed woman. Explain how the genotype of the man can be determined.
Look at the offspring. If they have enough children and if any of the children have blue eyes, then he is heterozygous for brown eyes. Even if all the children have brown eyes, it is still possible for the man to be heterozygous, as the next baby may have blue eyes!
- A man with blue eyes mates with a woman heterozygous for brown eyes. What is the probability of them having a blue eyed child? Remember that brown is dominant over blue eyes.
50% - Man = bb, Woman = Bb, so child will be either bb or Bb.
- Assume that white is dominant over black wool. Two white sheep produce a black offspring. What must the parents’ genotype for colour be? What is the probability that the next offspring will be black?
White is dominant so each parent must be Ww in order to produce a black sheep, ww. The probability of the next offspring will be the same as the first – 25%.W w W WW Ww w Ww ww
- Straight wings are dominant over curly wings in fruit flies. What is the probability of a straight winged offspring from the mating of a female with curly wings and a male that is heterozygous?
There is a 2/4 or 50% probability of a straight winged offspring.
S s S SS Ss s Ss ss
- Red fruit is dominant to yellow fruit in tomatoes. Tallness is dominant to shortness in these plants as well. What phenotypic and genotypic ratios would you predict for the offspring of parent plants; one of which is homozygous red and homozygous short while the other is heterozygous red and tall?
P1 RRss x RrSs
gametes of P1 Rs,Rs,Rs,Rs x RS,Rs,rS,rs
Since all of the gametes are the same in one plant, we need to only show one row on the Punnett square.
RS Rs rS rs Rs RRSs RRSS RrSs Rrss
Genotypic ratio
RRSs : 1
RRss : 1
RrSs : 1
Rrss : 1
Phenotypic ratio
red, tall : 2
red, short : 2 This can be expressed as a 1 : 1 ratio.
- In guinea pigs, black coat is due to a dominant gene while white is recessive. Short hair is dominant to long hair. A guinea pig which is heterozygous for black coat and short hair is crossed with a guinea pig which is homozygous recessive for both traits. Predict the outcome of the F1 generation.
P1 BbSs x bbss
gametes of P1 BS,Bs,bS,bs x bs,bs,bs,bs
bs BS BbSs Bs Bbss bS bbSs bs bbss
Phenotypes:
black coat & short hair 25%
black coat & long hair 25%
white coat & short hair 25%
white coat & long hair 25%
The genotypic ratio will be the same as the phenotypic ratio. See the Punnett square.
- Pea plants that are heterozygous for both stem length (Tt) (T = tall and t = short) and pod shape (Rr) (R = round and r = wrinkled) are crossed with each other. What are the phenotypes of these parents? State the phenotypes of the parents. What are the possible phenotypes of their offspring? Give the probability of each phenotype.
P1 tall, round x tall, round
genotypes TtRr x TtRr
gametes of P1 TR, Tr, tR, tr x TR, Tr, tR, tr
TR Tr tR tr TR TTRR TTRr TtRR TtRr Tr TTRr TTrr TtRr Ttrr tR TtRR TtRr ttRR ttRr tr TtRr Ttrr ttRr ttrr
This will be a phenotypic ratio of 9:3:3:1
tall, round – 9/16 (1-TTRR, 4-TtRr, 2-TtRR, 2-TTRr)
tall, wrinkled – 3/16 (1-TTrr, 2-Ttrr)
short, round – 3/16 (2-ttRr, 1-ttRR)
short, wrinkled – 1/16 (1-ttrr)
- White carnations are crossed with red carnations. Both white and red alleles show incomplete dominance. Give the genotype of the parent flowers and the genotype and phenotype of the offspring.
WW x RR = P1
4 RW = F1 – all pink carnations
R R W WR WR W WR WR
- In a cross between a white-eyed female fruit fly and red-eyed male, what percent of the female offspring will have white eyes? (White eyes are X- linked, recessive).
female is white-eyed - XwXw
male is red-eyed – XWY
Xw Xw Xw XwXw XwXw Y XwY XwY
None of the females will have white eyes
Why is it Important to Understand Heredity?
Hopefully you now have a good understanding of how alleles are passed on using Mendelian and non-Mendelian inheritance. Being able to understand how the process works enables us to determine the probabilities of a particular trait being passed on from one generation to the next. You can see how Punnett squares can be used to trace the path of autosomal and sex-linked genes from parent to offspring, and how this can help parents determine the probability of their child inheriting a genetic disorder such as hemophilia.
How do these disorder-causing alleles come about in the first place? Although some genetic disorders are not inherited, many of them are passed down from parent to child. This means that the egg and/or sperm cells must be carrying the disorder-causing gene. In the next section, you will explore how many genetic disorders can be traced back to meiosis and how the karyotypes you were introduced to earlier can detect chromosomal errors. Here you will also learn about various genetic disorders.
Genetic Disorders
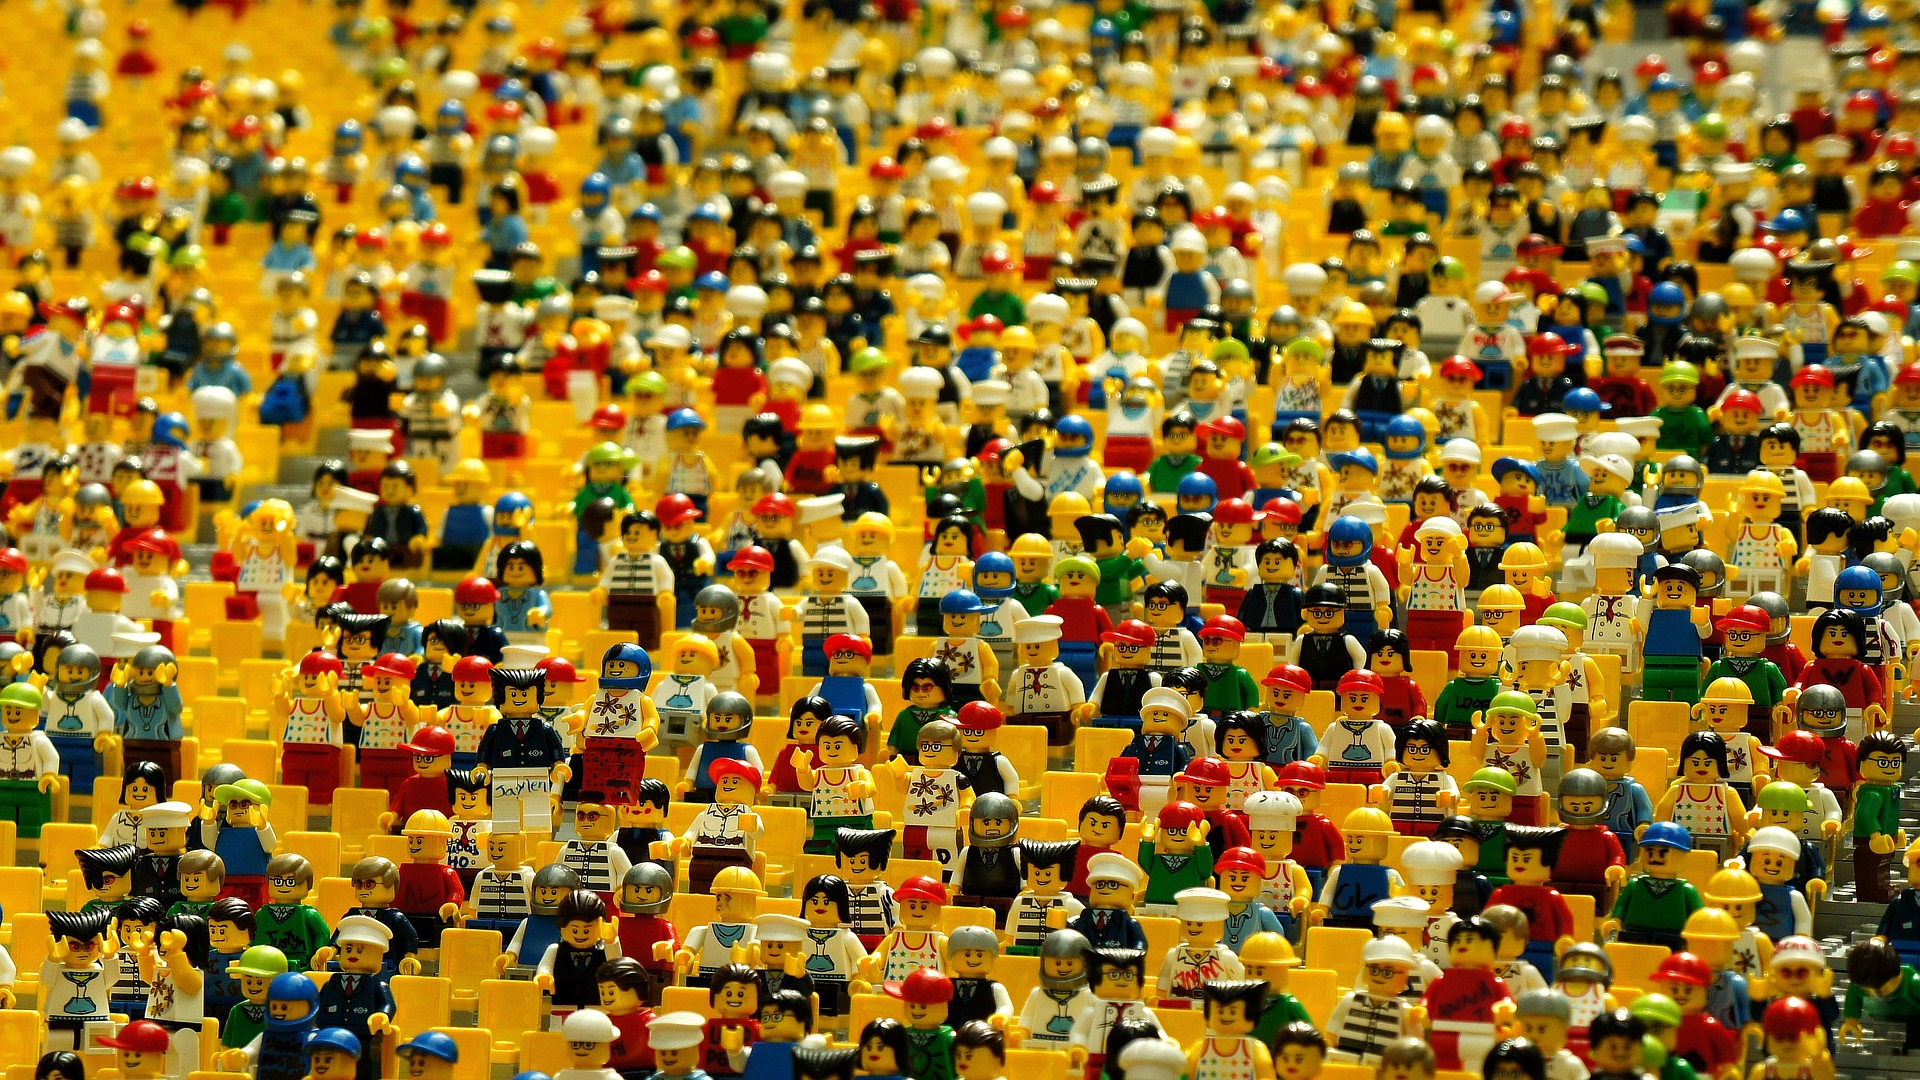
Take a minute to think of all the people that you know. Now think about the over 7.5 billion people with whom you share this planet. Obviously, the genetic processes that allow generation after generation to be created are working just fine!
Unfortunately, some issues can occur along the way. Sometimes these issues are very insignificant and don’t cause any trouble (or are not even noticed), while others can be life altering. How do these issues come about in the first place?
Back to Meiosis
In the last activity, you looked at the process of meiosis and how chromosomes are divided equally among the gametes produced. Yes, there is variance that occurs due to crossing over and independent assortment, but each viable gamete will end up with the haploid number of chromosomes. In humans, this means that each gamete will contain 23 chromosomes.
But wait...what if the chromosomes are NOT equally shared amongst the gametes? After all, we have 46 chromosomes in total. Big deal if we are missing a few or have a few extra.
It is important to remember that each chromosome holds a number of genes. If you have too few chromosomes, it may be that you are missing some important genetic information. The genes in your chromosomes are the blueprints for proteins necessary for proper functioning and growth. So, if you have too many chromosomes, certain proteins may be overexpressed and this can cause issues, as well. Our bodies are amazing machines, but they need the proper information to function efficiently.
Nondisjunction
If the chromosomes do not split evenly during meiosis, some of the gametes produced will not contain the proper haploid number of chromosomes. This uneven distribution of chromosomes is called nondisjunction.(definition:The failure of homologous chromosomes to separate normally during nuclear division.) The following video discusses the result of this nondisjunction occuring in meiosis I as compared to meiosis II. The terms mentioned in the video will be reviewed below.
In humans, this nondisjunction results in gametes with either 22 chromosomes or 24. If a gamete with the improper number of chromosomes fuses with another gamete, the resulting zygote will also have one too many or one too few chromosomes.
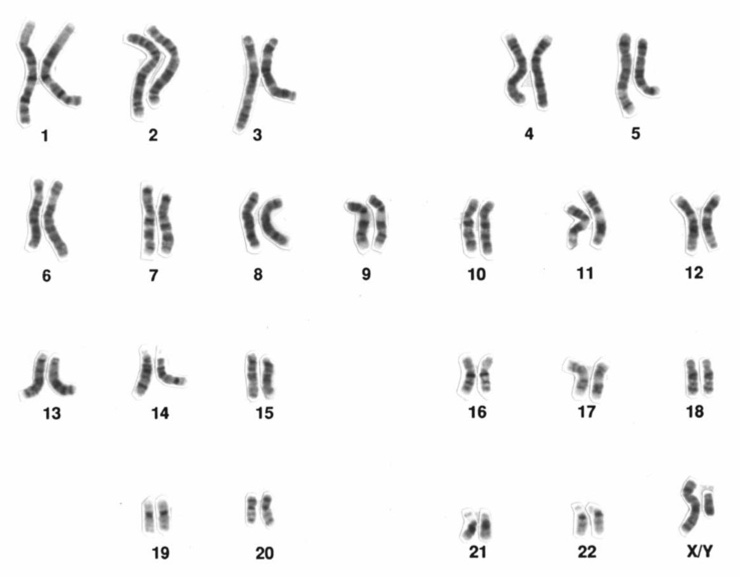
Remember that karyotypes show each pair of homologous chromosomes in an ordered fashion. In the normal karyotype above, each position has a total of two chromosomes. As you saw in the video, nondisjunction will result in an abnormal karyotype, with one of the positions having three chromosomes, known as trisomy,(definition:A condition where an three chromosomes is in place of a homologous pair.) or having only one chromosome, known as monosomy.(definition:A condition where one chromosome is in place of a homologous pair.)
Depending on the location of the trisomy or monosomy, the condition can prevent the survival of the zygote. If the zygote does survive, the extra or missing chromosome will result in a genetic disorder.
The following karyotype is the result of nondisjunction. You can see that there are three chromosomes in the 21st position. This condition is called trisomy 21, or Down Syndrome.
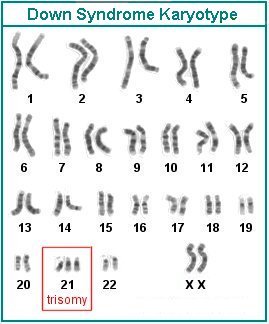
Down syndrome is associated with both physical and intellectual development issues and has an approximate incidence rate of 16 per 10,000 births in Canada. Visit the Down Syndrome Association of Ontario if you would like to know more about this disorder.
Nondisjunction Disorders
The following table, adapted from Nelson Biology 11, details some human nondisjunction disorders.
| Nondisjunction Disorder | Chromosome Abnormality | Characteristics of the Disorder |
|---|---|---|
| Turner Syndrome | One X and no Y sex chromosome. | Approximately 1:2,500 female births. Female is appearance but do not mature sexually and are sterile. Most Turner syndrome fetuses are miscarried before the 20th week of pregnancy. |
| Klinefelter Syndrome | Two X and one Y sex chromosome. | Approximately 1:500 male births. Males are usually sterile and exhibit some feminine body characteristics, but severity varies. |
| Patau Syndrome | Trisomy of chromosome 13. | Approximately 1:25,000 live births. Many serious developmental problems, including brain, kidney, and heart defects. Children rarely live more than a few months. |
| Edwards Syndrome | Trisomy of chromosome 18. | Approximately 1:6,000 live births. Many organ system defects. Very low survival rate. Most fetuses die before birth. Average life expectancy of live-born infants is less than one month. |
Non-Inherited Genetic Disorders
Not all genetic disorders are passed down from parents. In some cases, mutations(definition:When a DNA gene is damaged or changed in such a way as to alter the genetic message carried by that gene.) occur in the chromosomes that can disrupt normal development. One example is progeria,(definition:A rare syndrome in children characterized by physical signs and symptoms suggestive of premature old age.) where a single mutation that impacts one protein can cause premature aging.
This is the story of Sam Berns, who passed away at 17 from progeria in 2014. Sam helped raise awareness of the disease, and this awareness helped lead to the creation of the Progeria Research Foundation.
What Does it All Mean?
Throughout this activity, you have explored how traits can be passed on from generation to generation. From Mendel’s work on pea plants to the use of Punnett squares to predict outcomes, humans have made great advancements in understanding inheritance of traits and the science of heredity. As we continue to make advances in the field of genetics, the hope is that we will find a way to treat or even prevent genetic diseases.