Interactions and Change
Interactions Between Systems and Disorders
MINDS ON
The Amazing Body!

The human body really is an impressive machine! In the last activity, you saw how some of the main organ systems work intimately together to sustain life: to get energy and grow. It truly is amazing to think about all the specialized structures, biological processes, and metabolic reactions that need to function in concert. When all systems are in top form, the machine runs very efficiently.
But what happens when one or more of these specialized structures fails to work as designed? Since all the systems are so integrated, does the failure of one mean the failure of them all? Although certain disorders and diseases can be life altering, your body is incredible at adapting to changes to continue functioning and sustain life. Many scientists and medical professionals dedicate their lives to finding ways to detect errors within the systems and then to treating or controlling the effects of these errors in the best possible way.
Medical professionals have a whole host of diagnostic tools at their disposal, and you will explore some of these tools in this activity. Even without specialized equipment, the general functioning of some systems can be monitored. For the purposes of the course, though, we will be focusing on the systems you studied in the previous activity: the digestive system, the circulatory system, and the respiratory system.
The Baseline

Although most animals have some form of the systems we will discuss in this activity, the main focus will be on systems found in humans. You will be able to make a personal connection to these systems since each one is doing its job right now as you read this sentence! To increase this awareness, you will complete a series of tasks that will let you feel the direct impact that your actions and other external factors have on these systems, as well as how they are interconnected.
To be able to determine these impacts, you need to have an understanding of your baselines,(definition:Initial collection of data which serves as a basis for comparison with the subsequently acquired data.) or the normal functioning of your systems under stable conditions. You may have also hear this described as homeostasis. Factors such as emotional state, body temperature, stress and activity levels can affect these baselines, so it is best to determine these values right when you wake up.
Resting Heart Rate
A normal resting heart rate for an adult is anywhere from 60 to 100 beats per minute (bpm). A highly trained athlete can have a heart rate closer to 40 bpm!
Use the tips in the following video to determine your resting heart rate and record it. There are also apps such as Instant Heart Rate that can be installed on phones to help you take your heart rate. Be sure to practice this technique so that you can take accurate measurements in the rate investigation later on.
Resting Respiration Rate
Although this seems like a simple baseline to determine, there are some tricks that can make this more accurate. When you are aware that someone is counting your breaths per minute, you will often subconsciously increase or decrease the rate. This can give inaccurate results. One way to deal with this is ask someone to count your respiration for you when you aren’t aware she/he is doing it.
A normal respiration rate for an adult at rest is 12 to 16 breaths per minute. Be sure to record this baseline resting respiratory rate as you will also compare this later in this activity.
This video shows you a technique that an Emergency Medical Technician (EMT) may use to obtain an accurate respiratory rate:
Resting Blood Pressure
This reading requires specialized equipment, which will be detailed later in this activity. Some people have portable blood pressure machines at home, but a machine can usually be found at any pharmacy.
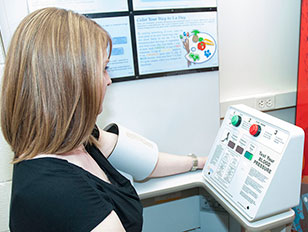
It is important to remember that these store-based machines have questionable accuracy and reliability. This is why you don’t see them in your doctor's office! The machines will, however, provide you with some idea of your blood pressure baseline.
If you do have the chance to use a blood pressure machine at a drugstore, it would be a great opportunity to speak to the pharmacist about medications used to control blood pressure. Have him/her explain how the medications can reduce blood pressure.
The blood pressure considered ‘normal’ is 120 / 80 mmHg, but this value can be affected by sex, age, and other factors. You will learn more about blood pressure in the Action section, including the units mmHg.
Important!
If any of your readings are well off the normal range, or you have any concerns, be sure to mention this to your family doctor. After all, they say that an ounce of prevention is worth a pound of cure (or better yet, 28.3495 g of prevention is worth 0.4536 kg of cure!)

Now that you have your baseline values, you are ready to look at the impact of internal and external factors on your systems. You will explore the influence that human interaction with the natural environment has on your body, and then be able to detect and suggest treatment for various disorders.
ACTION
Anatomy and Disorders
Lub-Dub: Circulatory System Monitoring
It’s easy to see why the contraction of those large cardiac(definition:Relating to the heart.) muscles can be felt in your chest - especially after exercise or watching a scary movie!
Is it these contractions that cause the classic ‘lub-dub’ sound when our hearts are beating? Maybe you noticed that in the animation. Watch this video to hear the normal heart sound and observe its relationship to the spikes of the ECG that was introduced in the last activity.
Actually, the sounds you are hearing are due to the valves opening and closing while the heart beats and the turbulence(definition:The pattern of fluid motion characterized by chaotic changes in pressure and velocity.) in blood flow they create. Use this heart diagram to follow along:
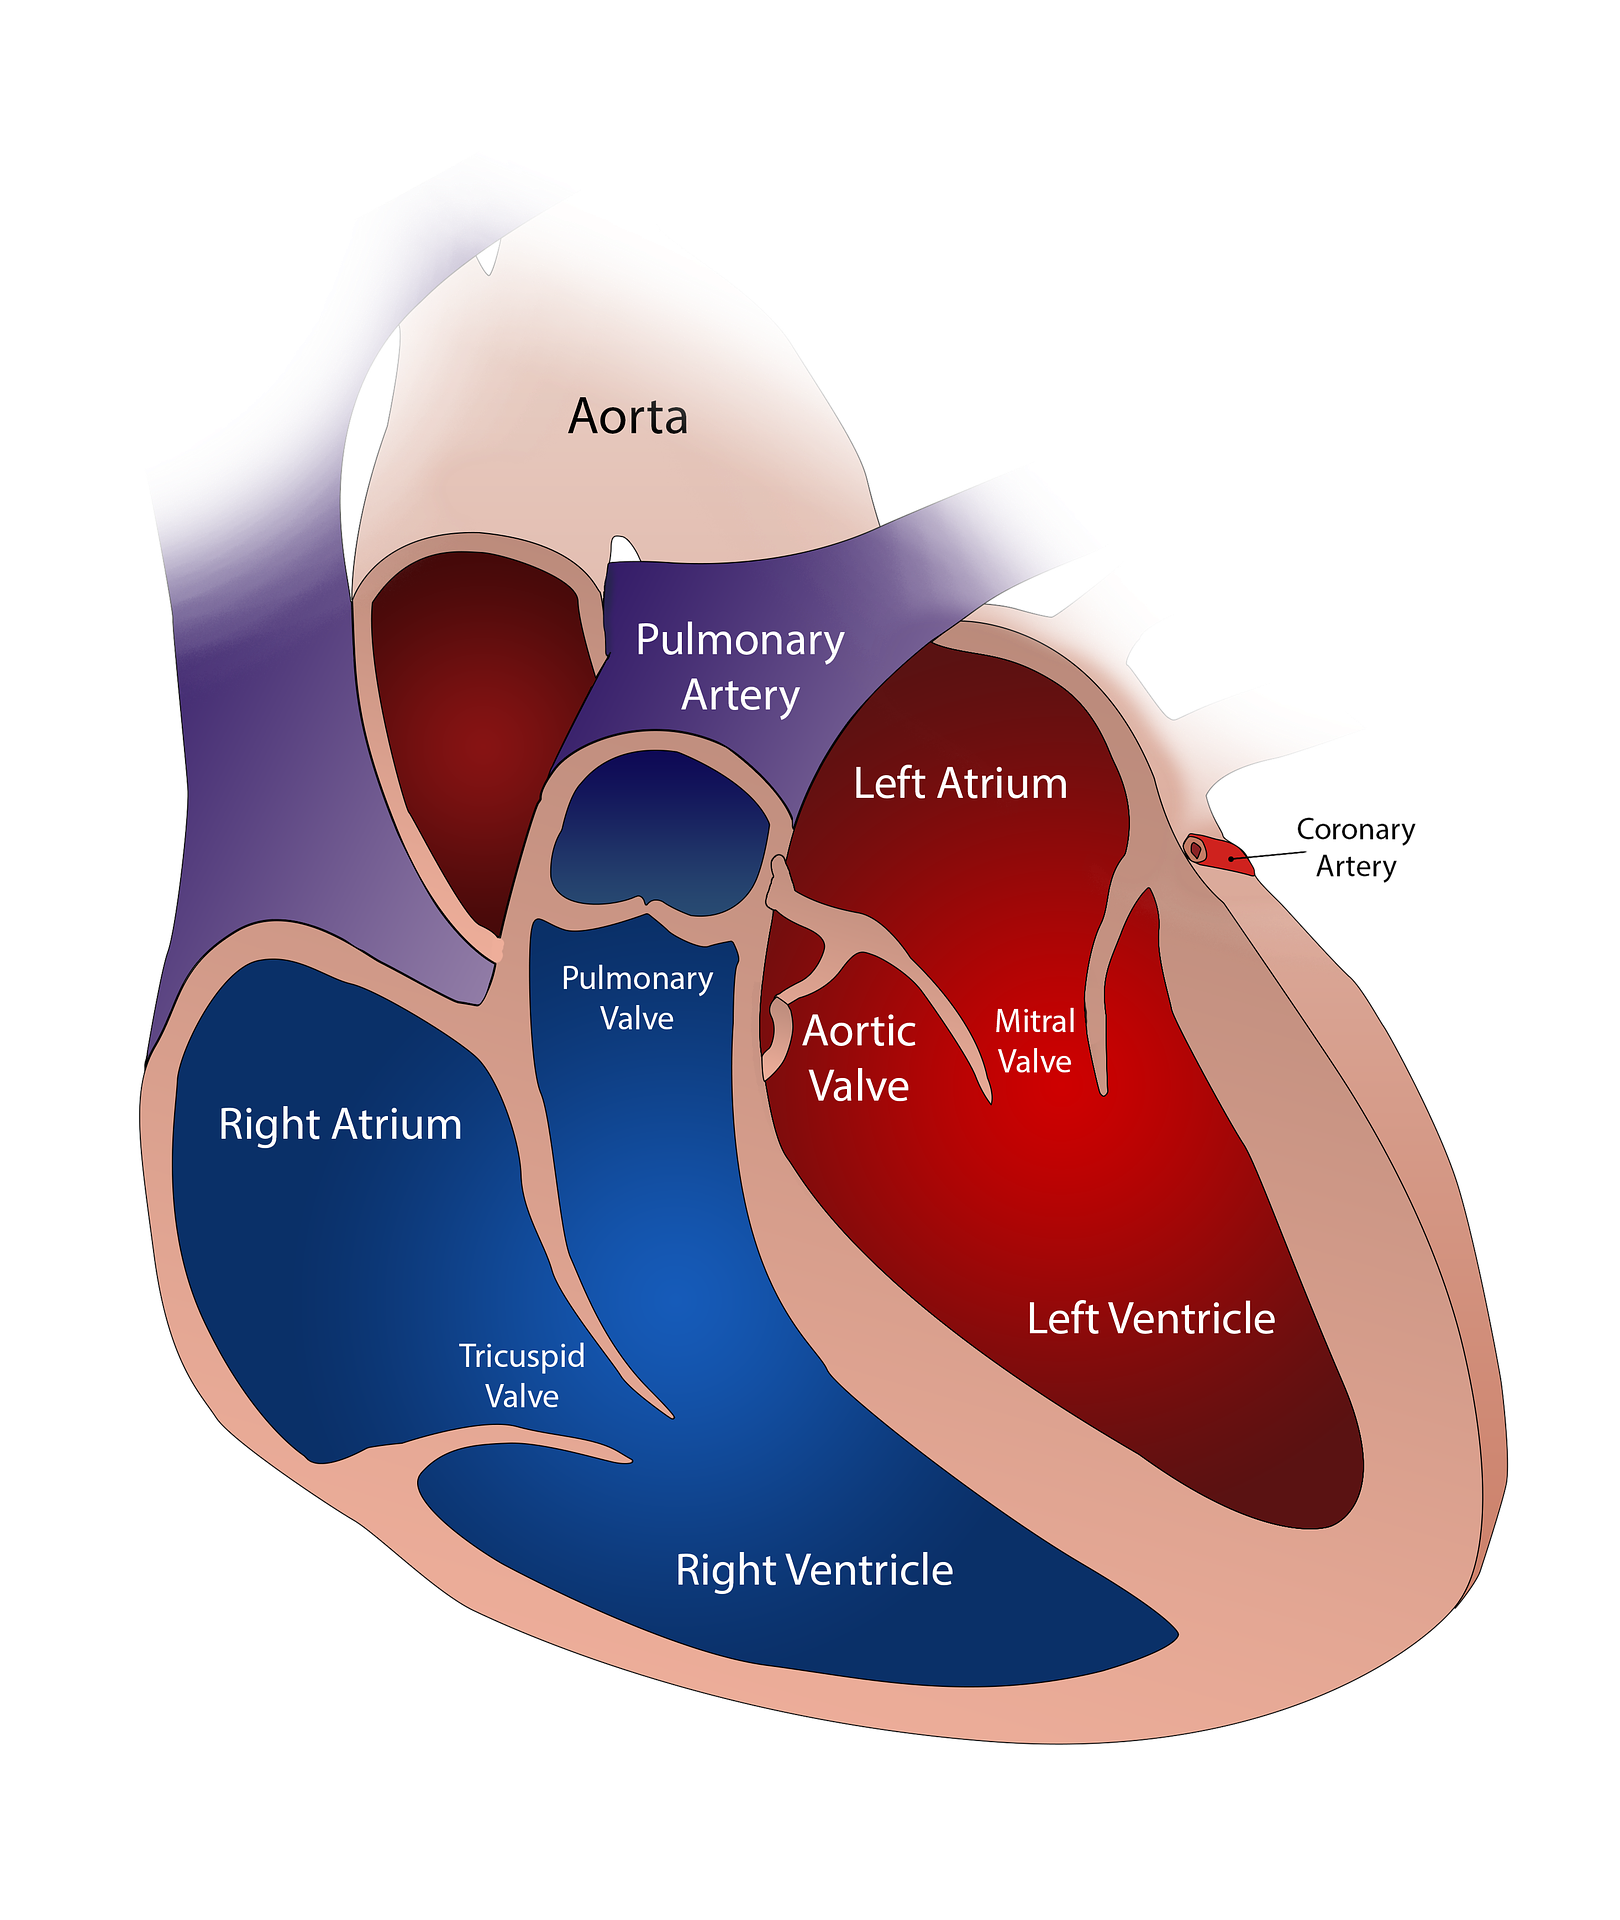
The first sound, the ‘lub’, is due to the turbulence caused by the closure of the mitral valve and the tricuspid valve after the blood has been pumped into the ventricles from the atria. The second sound, the ‘dub’, is created by the closure of the aortic valve and the pulmonary valve right after the ventricles pump the blood into the aorta and pulmonary artery.
On the above video of the heart sound, you can see how the electrical spikes on the ECG correspond to it. The contraction of the atria and ventricles, stimulated by the SA and AV nodes, causes the valves to open and close. Therefore, this creates the sound. Be sure to review how the heart rhythm is controlled in the last activity, if needed.
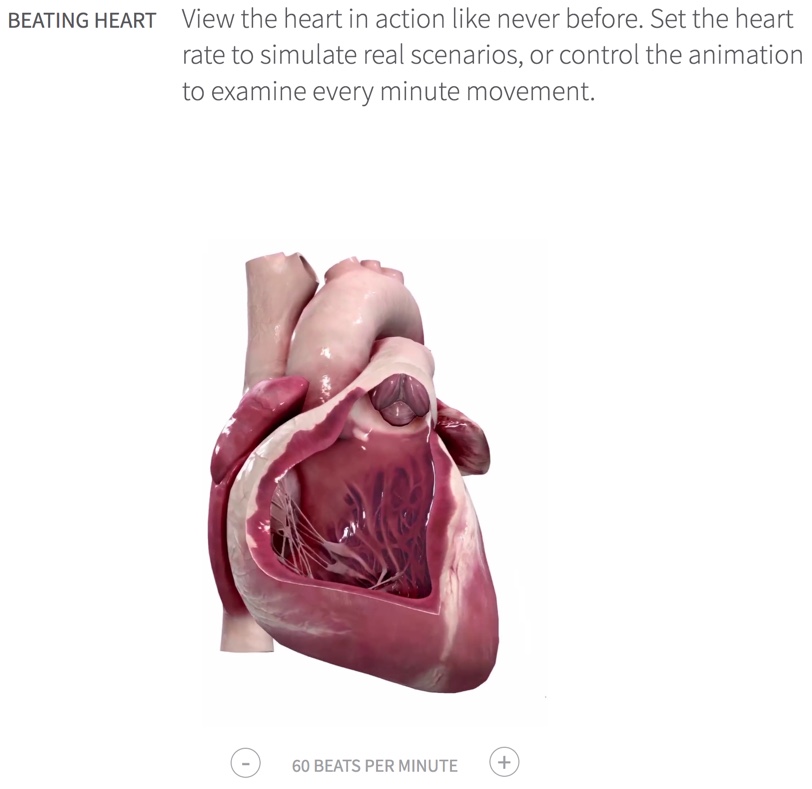
Click on the image below to be brought to a website where you can adjust the heart rate up and down to see the heart in action. Just scroll down to the Beating Heart section as shown in the image. There are some other interesting manipulatives on that site, as well. Take a look around!
Doctors use a stethoscope(definition:A medical instrument for listening to sounds produced in the body and especially those of the heart and lungs.) to listen to the heart or lungs. The stethoscope has a thin membrane called a diaphragm that will vibrate when sound is produced. This amplifies the sound and then sends it up the tubes to the doctor’s ears.

Blood Pressure
In the Minds On section, you recorded a baseline reading of your heart rate. You can feel the pulse of each beat as blood is forced through your arteries, expanding them. From earlier activities, you know that arteries have a thick layer of elastic muscle that serves to limit the amount of expansion. The elastic expansion that does occur helps push the blood along as the artery returns to shape between heart contractions.
It is this pressure that is exerted on the walls of the blood vessels that we refer to when we talk about blood pressure. Obviously a certain level of pressure is needed to be able to force the blood through all those tiny capillaries in your tissues, but too much pressure can be dangerous.
The greatest pressure is exerted on the arteries when the ventricles contract. This is called the systolic(definition:The blood pressure when the heart is contracting, specifically the maximum arterial pressure during contraction of the left ventricle of the heart.) pressure. The pressure is at its lowest when the ventricular muscles relax. This is called the diastolic(definition:The minimum arterial pressure during relaxation and of the ventricles of the heart when the ventricles fill with blood.) pressure. Together, these two pressures make up the blood pressure reading. As previously mentioned, the ideal systolic pressure for most people is 120 mmHg, and the ideal diastolic pressure is 80 mmHg, to give a blood pressure of 120/80 (read as 120 over 80). These values are based on the pressures in the brachial artery(definition:The major blood vessel of the upper arm.) located in your arm. Since pressure decreases as the blood flows away from the heart, other locations may produce different readings.
Did You Know?
mm Hg
The most common measurement of blood pressure is mmHg, which means millimetres of mercury (Hg is the symbol for mercury on the periodic table). Using the height of mercury to measure pressure is an old method, but it is still routinely used today. Mercury barometers were the first instruments that accurately measured pressure, so they set the standard. Atmospheric pressure pushes the dense mercury liquid up a glass tube. The greater the pressure, the higher the mercury rises. The height of the mercury is then measured in millimetres.
Measuring Blood Pressure
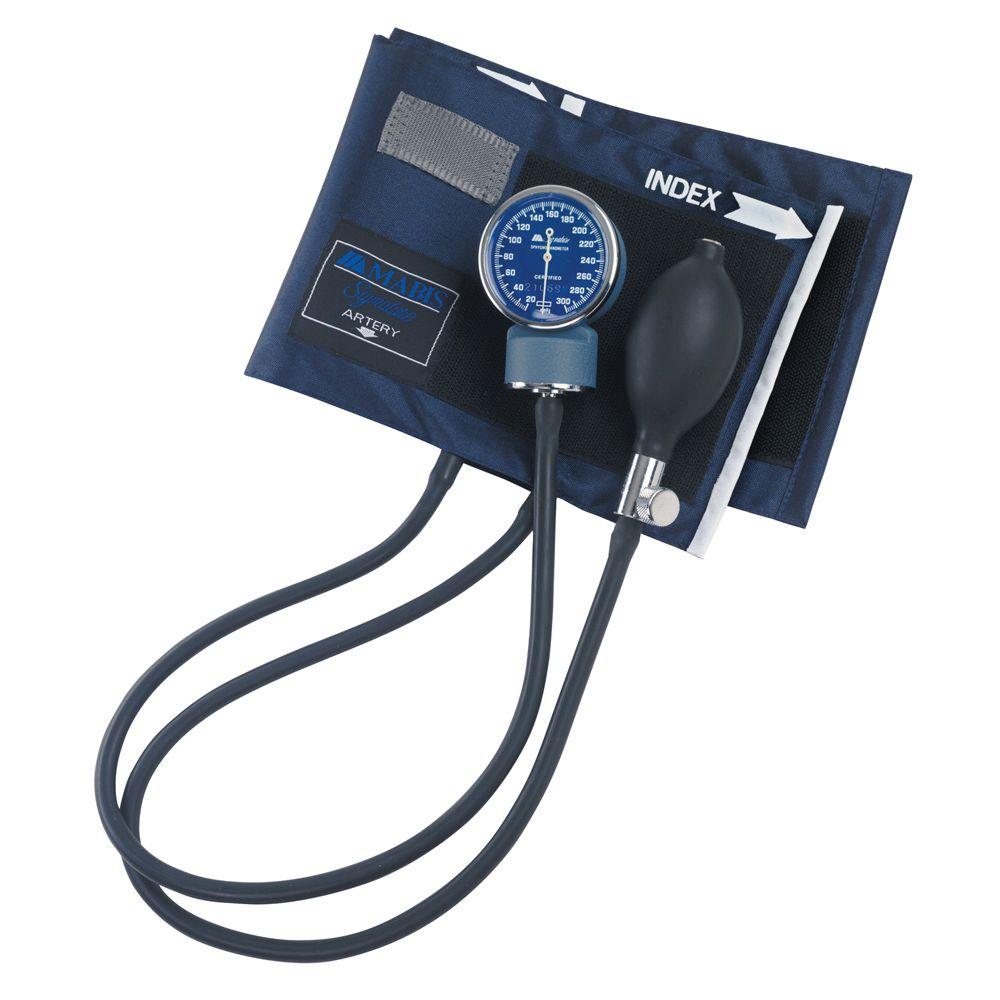
The equipment needed to measure blood pressure is a stethoscope and a device called a sphygmomanometer(definition:An instrument for measuring blood pressure, particularly in arteries.) (of course, it couldn’t be ‘blood pressure measuring thingy’).
A sphygmomanometer is an inflatable pressure cuff connected to a pressure meter. Some sphygmomanometers use an actual mercury tube to measure pressure, while others use an aneroid(definition:Not using liquid.) pressure gauge that uses a plastic diaphragm to measure pressure.
This video shows you the basics of using a sphygmomanometer to measure blood pressure:
Basically, the first heart sound you hear when checking the pressure is the systolic pressure, and the last sound you hear is the diastolic pressure.
This video will show you how to read the sphygmomanometer dial. Can you find the reading error in the video?
How did you do? It takes practice to get an accurate reading! Later on in this activity, you will use your blood pressure taking skills to help diagnose circulatory issues.
Respiratory System Monitoring

In the last activity, you learned how the action of the diaphragm and intercostal muscles creates a pressure differential, allowing you to inhale and exhale. You know that the oxygen then diffuses into the blood through the alveoli walls. After this, it goes to the cells in the body via the circulatory system. How much of the oxygen that you breathe in actually makes it to the cells to be used in cellular respiration?
The rate of oxygen usage by the body is known as VO2.(definition:A measure of the volume of oxygen that is used by your body to convert the energy from the food you eat into energy molecules.) The higher the VO2, the more efficient your respiratory system. This value can help you doctor understand how well your lungs are working.
The rate at which your body requires O2 is increased as the demand for energy increases. When exercising, the VO2 will rise as muscles are made to work harder. The maximum rate that O2 can be used by the body during sustained, intense physical activity is known as VO2max.(definition:The maximum amount of oxygen the body can utilize during a specified period of usually intense exercise.)
VO2 and VO2max both depend on a number of factors. Your age, weight, and sex all have an impact. Both values are measured in millilitres of oxygen used per kilogram of body mass per minute, or mL/kg/min.
The following chart, adapted from Nelson Biology 11, shows the ranges of VO2max depending on respiratory efficiency.
| Age and Sex | Very Poor | Poor | Fair | Good | Excellent | Superior |
|---|---|---|---|---|---|---|
| 13-19 M | < 35.0 | 35.0 - 38.3 | 38.4 - 45.1 | 45.2 - 50.9 | 51.0 - 55.9 | > 55.9 |
| 13-19 F | < 25.0 | 25.0 - 30.9 | 31.0 - 34.9 | 35.0 - 38.9 | 39.0 - 41.9 | > 41.9 |
| 20-29 M | < 33.0 | 33.0 - 36.4 | 36.5 - 42.4 | 42.5 - 46.4 | 46.5 - 52.4 | > 52.4 |
| 20-29 F | < 23.6 | 23.6 - 28.9 | 29.0 - 32.9 | 33.0 - 36.9 | 37.0 - 41.0 | > 41.0 |
VO2max (mL/kg/min) values based on sex, age, and efficiency.
How Are These Values Measured?
The VO2 and VO2max are relatively easy to measure using a device called a spirometer(definition:An instrument for measuring the oxygen consumption by the lungs.). This device is used to measure the volume of air moving in and out of the lungs. To measure VO2, you simply breathe into the mouthpiece of the spirometer. This video will give you a short overview of spirometry and how it can be used by health professionals.
Extension: What is My VO2max?
To measure VO2max accurately, you are usually asked to run on a treadmill - or ride a stationary bike - while breathing through the apparatus. There are, however, ways to measure VO2max without all this test equipment. It involves some math, but who doesn’t like math? Click on the image below to be brought to a number of methods used to get an idea of your VO2max.

Lung Capacity
Another measurement that can be used to evaluate your respiratory health is lung capacity. This, as the name suggests, is a measure of the volume that your lungs can hold. It can also be measured using a spirometer.
The volume of air that we breathe in and out under normal conditions is called the tidal volume(definition:The lung volume representing the normal volume of air displaced between normal inhalation and exhalation.) (TV). It is normally about 0.5 L in adults. When you take a really deep breath, you pull in more air than normal. This additional volume is called the inspiratory reserve volume(definition:The amount of extra air inhaled (above tidal volume) during a deep breath.) (IRV). When you breathe out normally, you can push out a little more air if you try. The additional air that you release is called the expiratory reserve volume(definition:The amount of extra air exhaled (above tidal volume) during a forceful breath out.) (ERV). Even after pushing out as much air as possible, a small volume of air remains in your lungs. This residual volume(definition:The amount of air left in the lungs following a maximal exhalation.) (RV) keeps your alveoli and lungs from collapsing.
The maximum volume of air that you can inhale and exhale is called the vital capacity(definition:The most air you can exhale after taking the deepest breath you can.) (VC), and includes all the volume other than RV. On average, this VC is 4.6 L in males and 3.6 L in females. The total lung capacity(definition:This is the vital lung capacity plus the residual volume and is the total amount of air the lungs can hold.) (TLC) is the VC and RV together.
This student doctor explains it much better! Pay attention, as the interactive below the video will test your understanding of the lung capacity graph.
The graph presented in the video provides a nice comparison of the various volumes and capacities. See if you can label the lung capacity graph in the following interactive. You will find the abbreviations for the various volumes in the content above.
Capacity
The measurements associated with the circulatory and respiratory systems are determined under normal, resting conditions (except for the VO2max). You already have your resting heart and respiratory rate from the Minds On section, so now it's time to see how various factors influence these values.
Respiratory Control

Challenge!
It is obvious that increased physical exertion will result in increased respiratory rate, but what causes this increase? Take a moment to think about what determines your rate of breathing.
Were you able to come up with an idea of what actually prompts your body to increase the respiratory rate? Yes, you can control the rate of breathing consciously to some degree (you can hold your breath or breathe faster or slower if you choose to), but there are unconscious controls, as well. After all, you continue to breathe while you sleep!
There is a good chance that you came up with the idea of oxygen demand as the main factor that controls breathing rate. This makes sense, as you know that muscle cells require oxygen to create energy through cellular respiration to contract. The more you move your muscles, the more energy is needed, so additional oxygen is needed.
Well…

The demand for oxygen does indeed have some control over breathing, but it is actually the concentration of CO2, the waste product of cellular respiration, that has the greatest impact on respiratory rate. Don’t feel bad if you went the wrong way on that one, as it is a very common misconception!
The CO2 waste from the cellular respiration diffuses from the cells into the blood to be carried to the lungs. Some of the CO2 combines with water to form carbonic acid,(definition:A very weak acid formed in when carbon dioxide dissolves in water.) which in turn lowers the pH of the blood. Chemical receptors in the brain and some arteries detect this decrease in pH and signal the respiratory centre in the brainstem (the medulla oblongata) to increase the respiratory rate. In addition, signals are sent to the heart to increase the heart rate in order to speed up the gas exchange.
So, your breathing and heart rate increase during exercise in order to reduce the level of CO2 in the body.
 Make the Connection!
It is easy to think of the various systems in our bodies as single entities, but you have seen time and time again how one system relies on the other. It is this interconnectedness that allows our bodies to function properly.
For each scenario below, indicate how each of the three systems, digestive, circulatory, and respiratory, all make a contribution to the proper functioning of our bodies.
- Heart rate increases during exercise.
- An adrenaline rush before taking your driving test.
- Oxygen levels decrease while sleeping.
Imagine You're a Doctor
Now that you know everything about blood pressure, heart rate, and lung functioning, it is time for you to look at some cases.
You will visit a virtual clinic where you will be presented with a series of medical issues. Each case gives you a brief history and allows you to check the blood pressure and listen to the lungs. Some of the information presented will obviously be a little above the level of content found in this course, but the cases will give you a better understanding of how difficult it can be to diagnose the many conditions that cross a doctor’s path. At this point, don't worry if you aren't familiar with some of the medical terms and diagnoses.
You will be presented with a number of cases under the Table of Contents title.
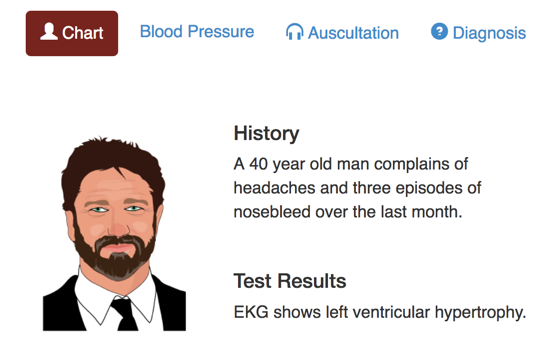
Clicking on any of the cases will present you with the patient’s Chart, similar to the image below. You can click on the Blood Pressure tab to find the systolic and diastolic pressures, and then you can listen to the heart and lungs by clicking on the Auscultation(definition:The action of listening to sounds from the heart, lungs, or other organs, typically with a stethoscope, as a part of medical diagnosis.) tab.
Finally, the Diagnosis tab will give you some additional information and then a chance to try to diagnose the patient’s condition. Don’t worry. It's multiple choice ... just like in a real doctor’s office! Not really.
Click on the sample image to open the clinic and try to diagnose at least two patients. Good luck!
Diseases and Disorders of the Systems
Unfortunately, these systems do not always perform as efficiently as they could. Diseases and disorders, some inherited and some caused by environmental factors, can have a real impact on how well they perform. When one system has an issue, all the other systems can be affected, as well.
Many of these diseases and disorders can be detected early and successfully treated. Special diagnostic tools and medical procedures have helped people with various issues lead happy and productive lives. Advancements in the medical field are made all of the time, and more and more treatments will be available in the near future.
The following interactive will detail some of the more common disorders associated with the circulatory system and their common treatments. Click on each point on the diagram for additional information. As you work through each disorder, think about the structure of the circulatory system from the previous activity and try to get a sense of how that disorder impacts its proper functioning.
CircDisorders
Respiratory Disorders
There are a number of diseases and disorders that have an impact on the respiratory system, as well. Some are inherited, while others are due to environmental factors. As you go through each disorder, think about the structure of the respiratory system from the previous activity and try to get a sense of how each disorder affects its proper functioning.
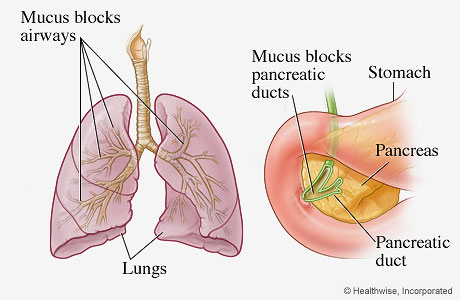
Cystic Fibrosis

Cystic fibrosis (CF) is a fatal genetic disease that impacts children and young adults. Currently there is no cure, but research is ongoing.
CF is a multi-system disorder that not only impacts the lungs, but also the digestive system. Thick mucus develops within the lungs, making breathing and gas-exchange difficult. Wheezing and shortness of breath, as well as frequent chest infections, are a result of the disease and can cause further lung damage. CF also causes difficulty in digesting fats and proteins because the duct from the pancreas to the duodenum is blocked by mucus. People with this disease can suffer from malnutrition and vitamin deficiency because of incomplete chemical digestion of food. Cystic fibrosis also produces sweat that is much saltier than normal.
As this is a recessive autosomal disease, both the mother and father need to be a carrier, with each parent passing on the CF allele. The carriers do not suffer any symptoms from the CF. If both parents are carriers, there is a 25% chance of producing a child with the disease. Diagnosis is made by a simple sweat test, which measures the amount of salt in the sweat.
Although there is currently no cure, various treatments can help ease the symptoms. Chest physical therapy can be used to loosen and help remove the mucus. Medications can be used to thin the mucus, as well. Antibiotics are often used to treat the bacterial infections common to CF patients.
For more information about cystic fibrosis, visit the Cystic Fibrosis Canada website.
Chronic Obstructive Pulmonary Disease (COPD)
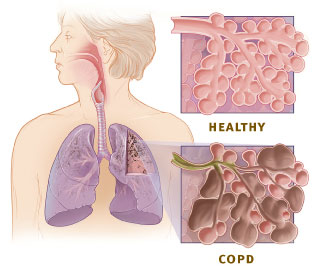
COPD is the name used to describe a set of lung diseases that block airflow. Asthma, emphysema, and chronic bronchitis are examples. These conditions will be detailed in this section.
Possible long term impacts of COPD include heart disease and lung cancer. Talking to a doctor and dealing with these COPD issues early on can keep any lasting damage to a minimum.
Lifestyle changes, avoiding triggers that cause breathing issues, and special breathing exercises can be effective treatments for COPD.
Visit the COPD Canada website for more information.
Asthma
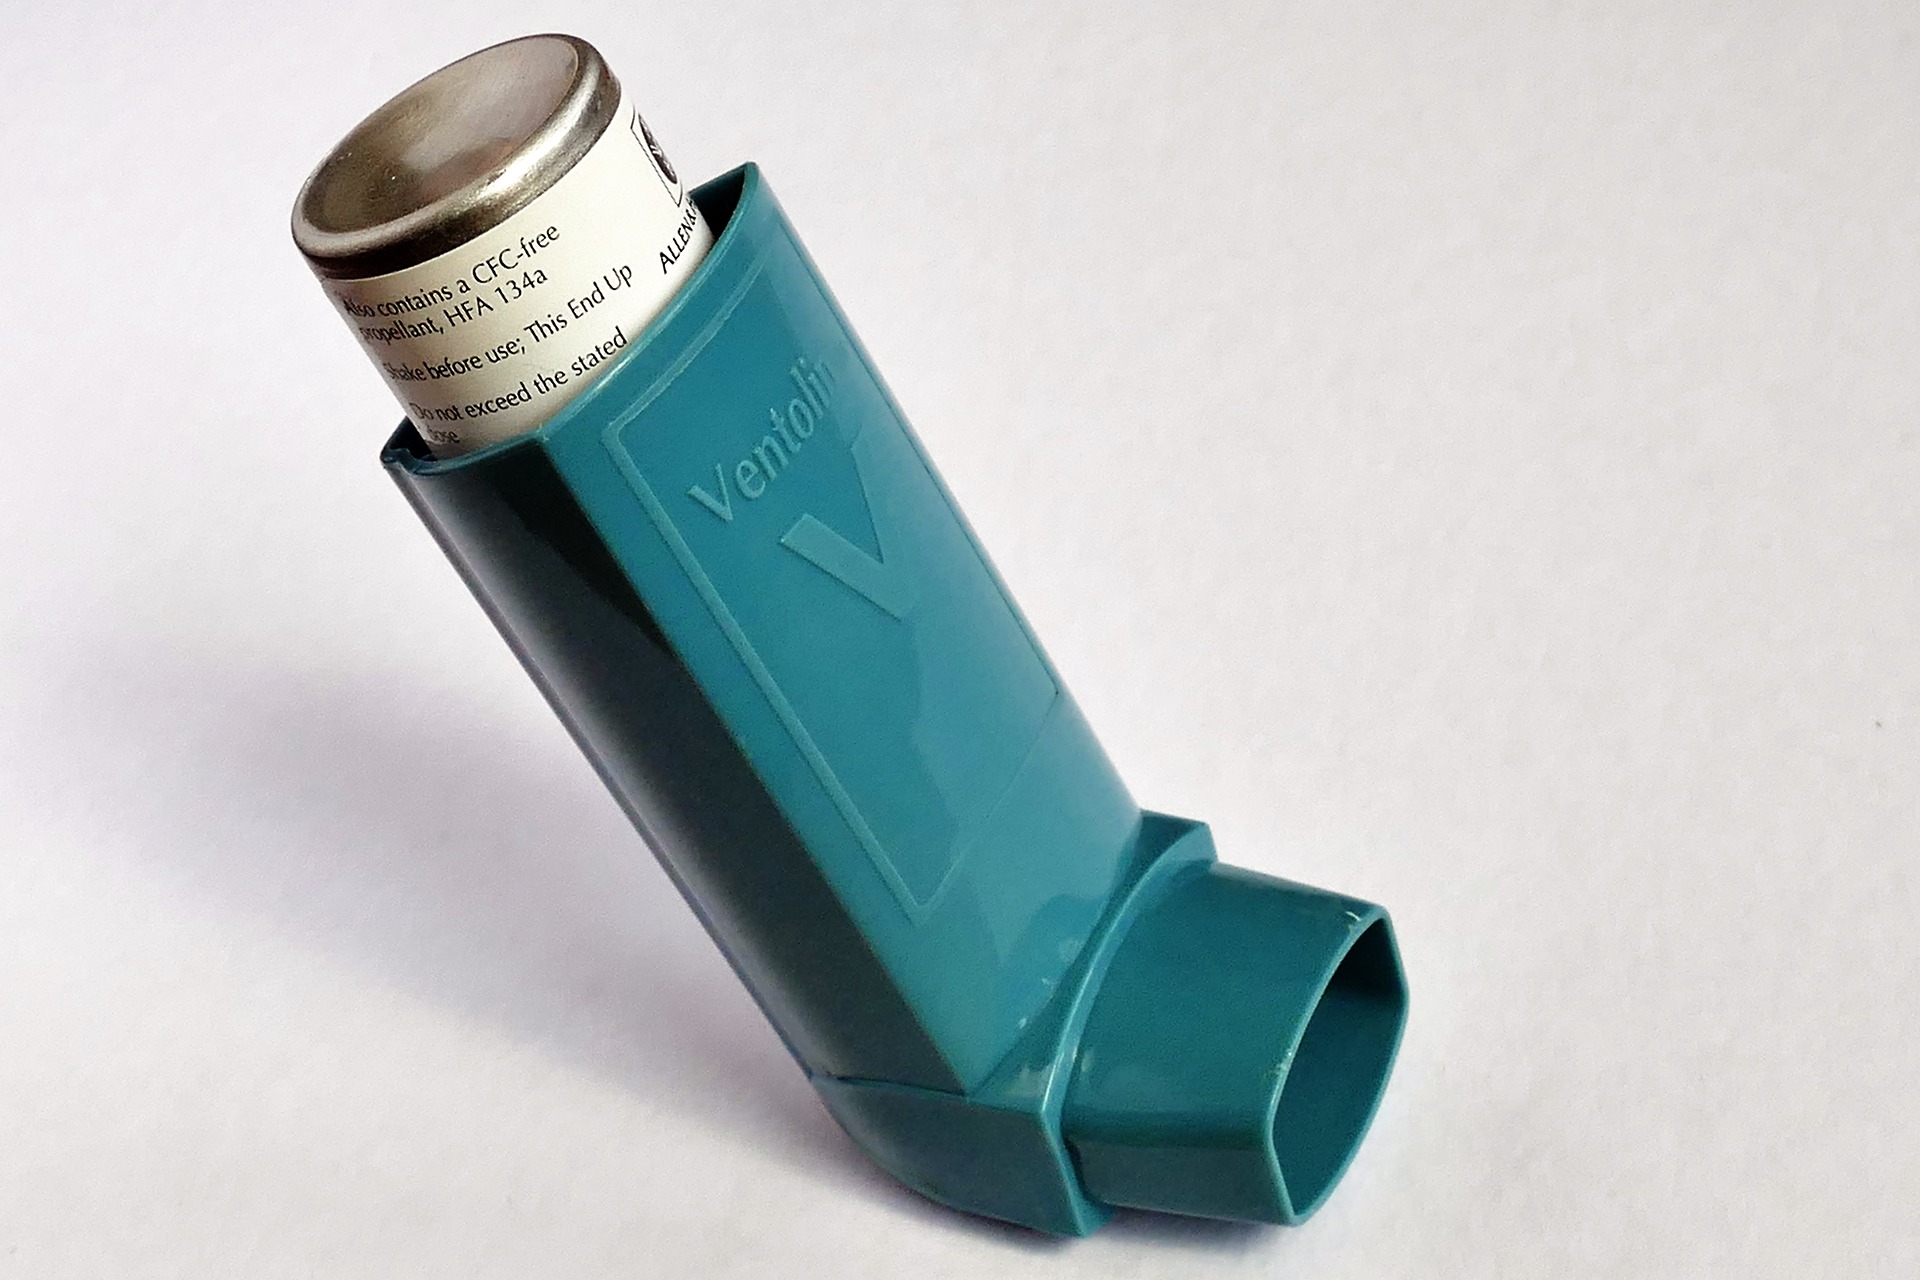
Asthma(definition:A condition in which your airways narrow and swell and produce extra mucus. This can make breathing difficult and trigger coughing fits.) is classified as a chronic(definition:Persisting for a long time or constantly recurring.) inflammatory disease of the airway. Symptoms include shortness of breath, chest tightness, coughing, and wheezing. These symptoms can be mild or severe. In some cases, environmental conditions such as cold temperatures may trigger the symptoms to flare up.
The actual cause of asthma is still unknown, but researchers believe that this condition can be inherited, as well as caused by environmental factors.
There is no cure for asthma, but the symptoms can be controlled completely by medications that relax the tissues in the airway. Avoiding triggers will also help to control symptoms.
For more information about asthma, visit the Asthma Canada website.
Emphysema
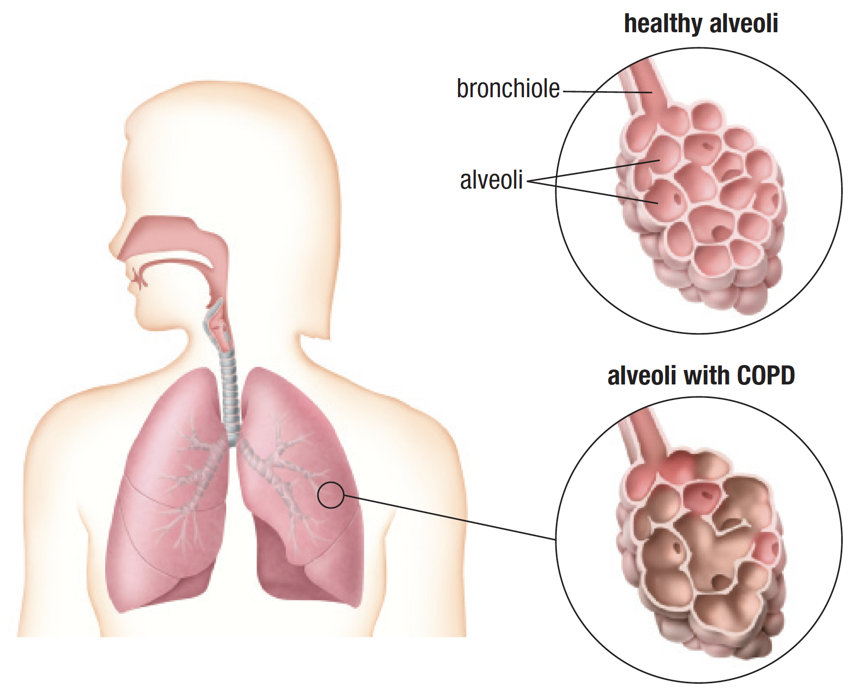
Emphysema is a chronic lung condition where the alveoli become larger, but decrease in number. The tissue around each alveolus is normally elastic. It usually expands and shrinks while someone is breathing. Emphysema stiffens these tissues and they stay stretched, so gas exchange is not as efficient and air gets trapped in the alveoli instead of being exhaled.
Symptoms include shortness of breath, fatigue, and chronic coughing. There is no cure, but the symptoms can be treated if dealt with in the early stages. This will slow the progression of the disease. Medications that relax the tissues in the airway, along with breathing exercises, can be used to help with the symptoms.
Some connections to heredity have been made, but this genetic abnormality accounts for only 1% of emphysema cases. Most emphysema is caused by external factors such as smoking, air pollution, and chemical exposure.
Spirometry can be used to detect the progression of emphysema, as can tests that detect the concentration of gases in the blood.
Visit the COPD Canada website for more information.
Bronchitis
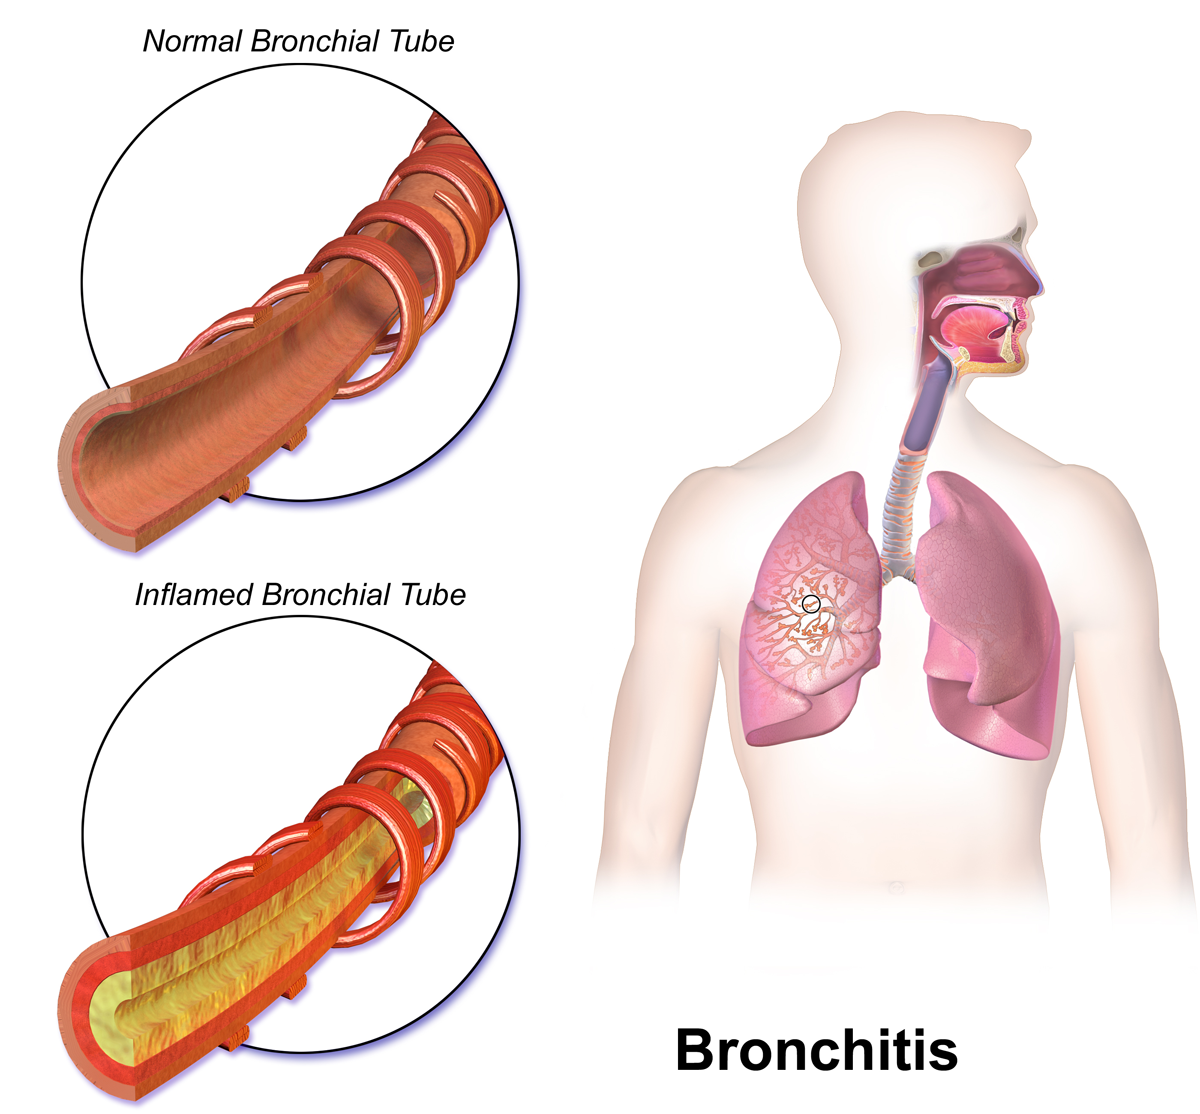
Bronchitis is a condition where the lining of the bronchial tubes becomes inflamed. Acute(definition:A pain or illness is one that quickly becomes very severe.) bronchitis describes the short term effects of a viral or bacterial infection, while chronic bronchitis is long term, and caused by extended illness or environmental factors such as smoking and exposure to chemicals or irritants.
Symptoms include persistent cough, wheezing, shortness of breath, and fatigue. These symptoms may get better or worse depending on the season and the environmental factors that are present.
Bronchitis can be diagnosed by a chest x-ray and lung sounds. The symptoms can be treated by a number of medications that open the bronchioles, and antibiotics if the symptoms are caused by bacterial infection. Breathing exercises, avoiding the triggers, and exercise can all help relieve the symptoms.
Visit the Canadian Lung Association website for more information about bronchitis.
Digestive Disorders
Disorders of the digestive system are quite common, and you most likely know someone with one of the conditions that will be explored. Many can be controlled with lifestyle changes and diet, while others are more sinister.
Use the following interactive to learn more about some of the more common digestive system disorders.
DigDisorders
Did You Know?
Crohn’s and colitis are similar diseases, and are both considered Inflammatory Bowel Disease(definition:An umbrella term used to describe disorders that involve chronic inflammation of your digestive tract.) (IBD). Scan through this video to get a better idea of the similarities and differences between these two diseases.
Only some of the more common diseases and disorders that impact the circulatory, respiratory, and digestive system have been included in this activity but there are many more. Can you think of any other conditions that were not included in the content above?
What Does it All Mean?
The last two activities have let you explore the anatomy and physiology of some very important systems found in animals. Each has a very specific role, but at the same time our overall health relies on these systems to work together efficiently. The healthy functions of the cardiovascular and respiratory systems can be measured to see this interaction. They can also be used to diagnose disorders.
Because these systems work in concert with each other, when issues arise, all of the systems can be affected. This interaction occurs between all of the systems in your body, and is not limited to the three that were detailed in these activities.
This activity has also given you a chance to see how various heredity and environmental factors can play a role in diseases and disorders that affect these systems.