CGW4U
World Issues: A Geographic Analysis
Unit 2: Asia
Activity 1: What is the right population size for the planet?
In this activity we will consider the question: What is the right population size for the planet? Is there a “right” size? Many people believe that the earth is overpopulated, but is this true?
Population Clock
Click on the image below to view the current world population at Worldometers.
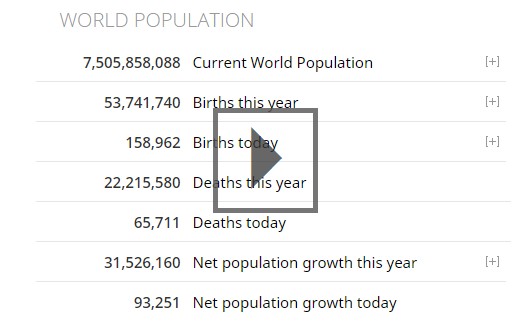
Look not only at the current world population, but also at the rate at which the world's population is growing.
With this information, what are your current thoughts (and feelings) about each of the following:
- Overpopulation.
- Sustainability of our resources in relation to our population growth.
- What is the geographic perspective on growing populations (Social, Political, Economic and Environmental)?
- What parts of the world are experiencing the greatest or slowest growth?
 Enrichment
If you want to read a little more about these facts, check out:
 Issues Café: Population Thoughts
- What role, if any, should a government have in controlling their countries population?
- How could a growing global population impact different regions of the world?
Our Global Population: Where and how many?
Demography is the study of populations and demographers are the people who undertake those studies. Demographers work to identify and respond to global demographic change: Why is life expectancy in Canada (82 years) so much higher than Swaziland (49 years)? They also investigate national demographic changes (e.g., Canada’s aging population). Once the statistics identify a pattern or a trend, demographers work to describe and explain its causes and consequences.
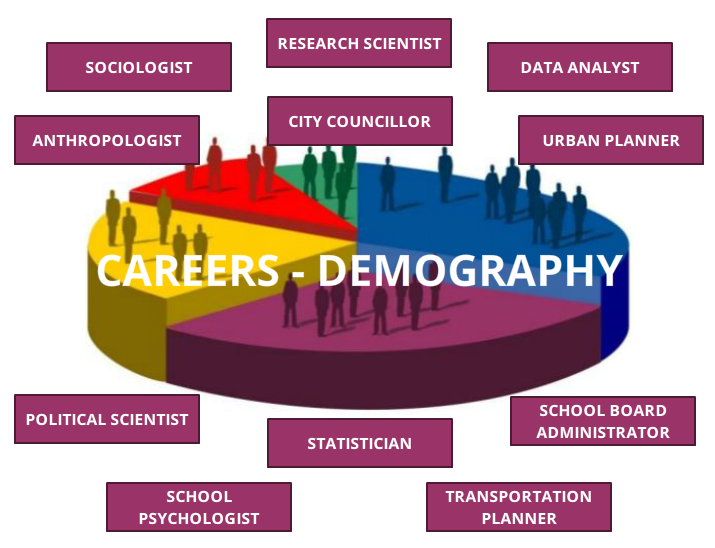
Demography then, uses statistics including, but not limited to birth rate, death rate, age, sex, and migration. Additionally they use population density (a measure of the number of people living in a square kilometer) and population distribution (where the population is located).
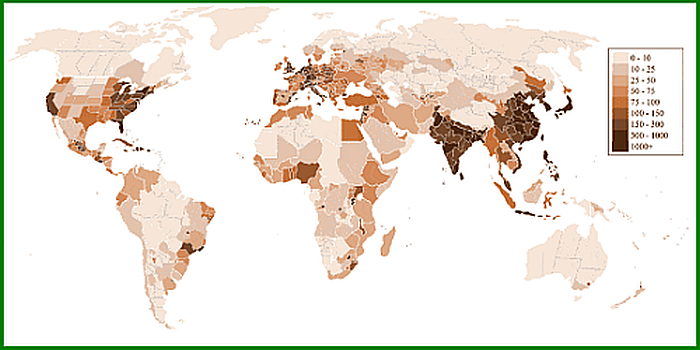
What population pattern is evident on the following map? What social, political, environmental or economic issue(s) could explain the pattern you identified?
World Population Density (people/km2)
Population Theories
This Khan Academy video explains the population theory of Reverend Thomas Malthus, an English economist. Malthus is credited with being the first person to author and publish an essay dealing with population growth in relation to food supply. He went on to suggest that war, disease and famine were the natural “limits” to population growth. These “Malthusian checks” would help keep the population low enough for the available food supply.
More recently (1982) William Catton published his ideas about population growth.
Mayfield Geography Department
Long Description
Theories of Malthus and Catton
Use the following organizer to summarize in your own words and record your thinking about the theories of Malthus and Catton.
In one lens enter the attributes and important points of the Malthusian Theory on Population. In the other lens area list attributes and the most important details about Catton’s Theory on Population. In the nosepiece area answer the question: How do I see the future of the world’s population?
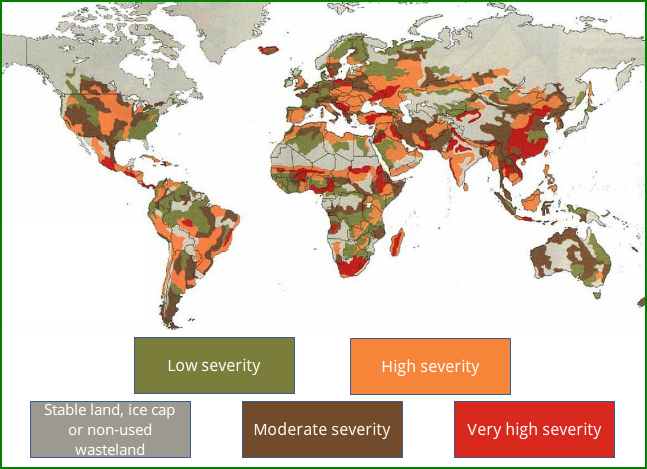
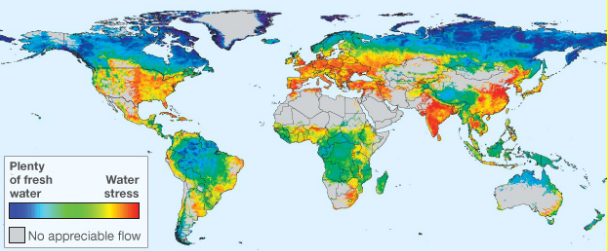
You will need to be succinct. Use the two maps below to help you arrive at your opinion.
What do they say to you about the current paradigm that suggests that the earth is overpopulated? Is the earth overpopulated for the resources we have? If you are uncertain at this time, pose two or three questions and explain how they would help clarify your thinking about overpopulation.
Global Status of Human-Induced Soil Degradation
Global Status of Unmanaged Freshwater
Overpopulated: Myth or Fact?
Many people believe the earth is overpopulated, but if we look a bit deeper we may find that the earth is, in places, over-crowded, not over-populated. In fact many think that the idea of the world being overpopulated is a dangerous myth. When our global population surpassed the 7 billion mark, it was certainly reason to stop and consider the implications of a population of this size.
View the following three videos. Are your criteria to measure overpopulation used in any of these video clips? If we have sufficient amounts of food, water and shelter, perhaps we are not overpopulated at all? When we perpetuate this world view, we neglect to address other real issues: forced population control, food distribution, human rights abuses and many others.
Demographic Transition Model
We can identify some patterns and trends that populations around the world seem to go through. The Demographic Transition Model (DTM) is the most widely used tool that illustrates the typical changes populations have made as they experience economic or industrial development.
Population Pyramids
Population pyramids are useful because they allow us to compare countries, and help to forecast future trends. For example, in Canada our growing elderly population may mean more retirement and seniors facilities are needed. On the other hand, an increase in younger people, as seen in our Indigenous communities may mean more schools are required.
In general, population pyramids show:
- The population of a country or region divided into five-year age groups.
- The percentage of people in each of these age groups.
- The percentage of males and females in each age group.
- Changes in birth and death rate, life expectancy and infant mortality.
- The proportion of elderly and young people who are dependent upon those of a working age - known as the economically active.
- The effects of people migrating into or out of the country or region.
- The effects of government policies e.g., China's one child policy.
Animated population pyramids help to visualize changing populations. This TED talk, Population Pyramids: Powerful Predictors of the Future, illustrates the power of the population pyramid.
 Population Pyramids
The following task will allow you to both check your understanding of population pyramids and also to consider the wide-ranging implications of different population structures.
You may wish to create something resembling the template below:
| Category | 2016 Rwanda | 2016 United Arab Emirates | 2016 China | 2016 Angola | 2016 France | |
| Life Expectancy | ||||||
| Infant Mortality | ||||||
| Growth (stable, declining, expanding) | ||||||
|
Gender imbalance |
||||||
| DTM stage represented | ||||||
| Access to health care | ||||||
| What are your predictions for the future of this population? |
After you have completed your analysis, select one of the population pyramids (Rwanda, UAE, China, Angola or France) and respond to the following:
What reasons can you suggest for the pattern it shows (i.e. Why has this particular pyramid occurred? What events may have shaped it?)
Describe possible consequences of this population structure. Consider social, economic, political and environmental realms.
What are possible solutions to the consequences you have identified above?
Quality of Life for all?
What most people care about is not represented in the numbers or the maps, but the quality of life that people experience and hopefully enjoy. We can use the population theories, Demographic Transition Model and population pyramids to determine our quality of life and also the impact that population changes have on our natural environment. Really, we can better understand our sustainability through population studies.
When we use the term “quality of life” we are referring to the general well being of individuals and societies, including not only wealth and employment but also the environment, physical and mental health, education, recreations, leisure time and social belonging. You can see that the notion of quality of life would change from place to place and from person to person.
When it comes to quality of life, what matters to you?
Demographer Hans Rosling uses simple Ikea boxes to illustrate the role improved living standards and quality of life, especially for the poorest, will play in limiting our global population growth.
What is the “right” size of population for the world? Is the earth overpopulated, or in places is it overcrowded?
Quality of Life
Go to the interactive map on the Population Reference Bureau website.
Part A
- Select any LEDC. Look through the maps and data tables to become familiar with the range of population data that is available.
- Select three different data sets (maps) and one indicator from each to paint a picture of the Quality of Life in that country in 2015.
- Use the tables to find the specific data for your selected country.
- Create a table to organize the data you have collected to share with a classmate.
- Write a paragraph that explains how the data supports your interpretation of the quality of life experienced by the people in that country.
- Explain how improved standard of living and quality of life can contribute to global population control. Is it an important, even critical, component in achieving the “right” population for the planet?
- Increased levels of development and quality of life will certainly involve an increasing trend of movement into cities. What impact would you predict this will have on our natural environment and global commons?
- Look again at the map of population density at the beginning of this activity. What connection or pattern(s) would you identify between global population distribution, population density, and quality of life?
| Yes/No | Task Checklist |
|---|---|
| I have selected a Less Economically Developed Country. | |
| I have three (3) data sets and one (1) indicator from each. | |
| The data I have selected best demonstrates the quality of life for that country. | |
| I have organized all the data into a table. | |
| I have used the data I have collected to make connections and generalizations to the quality of life in that country. |
Share your data and analysis with a friend or family member.