Biological Processes and Interactions
Biotic Interactions and Population Dynamics
MINDS ON
 Some Key Terms about Population Dynamics
Can you anticipate the terms in this Activity? Use specific details from the Learning Goals, Success Criteria, and Introduction to help guide you. Practice good Organization skills (definition:I can identify, gather and use resources to complete a task.)by referring back to concepts you have seen in other classes, or using your responses to Energy questions in the ePortfolio to identify at least 5 important terms.
Coming up, many more important terms will be identified in bold. Add these terms to your Portfolio as you work through this Activity. Look for opportunities to include more relevant terminology related to population dynamics as you work through the tasks and discussions.
Positive and Negative Factors in Population Growth
Population growth is a balance between positive and negative factors. For example, natality and immigration lead to increases in population, whereas mortality and emigration lead to decreases. The energy available to individuals in a population leads to different survival outcomes. If there is an abundance of energy available then birth rates and possibly immigration rates increase. For most species, though, the energy they utilize is limited to its impact on metabolic processes. Autotrophs grow better with an abundance of light energy while heterotrophs benefit from an abundance of organic sources of nutrition.
Human populations, on the other hand, utilize a greater variety of energy sources in our food systems. The following video summarizes some of the changes in sources of energy over time.
With each invention we were able to sustain a greater number of people. With the world population currently over 7.5 billion people (check Worldometers for the exact number) there is concern over how much higher the population will grow. Could a planet with 12 billion people be on the horizon? Watch this next video to see if this prediction is realistic.
How do small steps lead to changes?
Changes 12. Using specific details from the video on overpopulation, explain how the balance in positive and negative population growth factors affect how human population number changes.
Natural populations are similarly affected by positive and negative factors affecting population growth. For example, salmon populations in key rivers in British Columbia have seen a decline over recent decades. The causes are manyfold and interconnected. A quick Google search for fraser river salmon decline will show you just some of the causes.
Energy in Human Food Chains
One invention that altered energy sources is cooking. Some animals can use tools to capture more food, but only humans cook their food prior to eating it. The advantages to this behaviour, which takes both time and added energy, are described in the following video.
How does energy move in food systems?
Energy 6: Using specific details from this video, suggest how human food systems might have been different if cooking was never invented?
With each invention in energy sources there have been consequences to the environment that balance the benefits to human food systems. The invention of agriculture, for example, changed ecosystems from grasslands, forests and estuaries to pastures, cropland and paddocks. This and other consequences to the natural environment have lead people to question our impact on our world. All species have an ecological footprint(definition:the area of biologically productive land and water needed to provide the resources for and assimilate the wastes from human activities.)that is a product of population size, the intensity that they take resources from their environment, and the waste they produce. It’s sobering to realize that the per capita(definition:per person)footprint for Canadians is more than the biocapacity (definition:the ability of a biologically productive area to provide resources and assimilate wastes.)of 5 Earths. Let’s explore some of the choices to reduce ecological footprint.
 How does energy move in food systems?
Ecological footprint is the product of three factors:
- population size,
- intensity of resource extraction,
- intensity of waste production.
Each of these factors puts strain on our food systems. Search for a strategy human populations or individuals can make to reduce one of the three factors that contribute to our ecological footprint. Practice good Initiative skills (definition:I can look for and act on new ideas and opportunities for learning.)as you consider strategies that could be specific to a particular part of the world. How would this help our food systems to be more effective at producing quality food?
ACTION
Describing Population
When it comes to describing changes in population we must first be able to describe it at a specific point in time. The size, mobility, distribution, and behaviour of individuals in a population as well as the area and accessibility of the habitat are all considerations in how the size of the population can be determined.
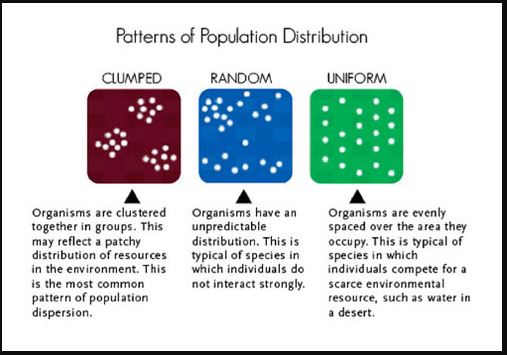
by CK12 used under NonCommercial CC BY-NC
These patterns of distribution are useful in describing natural populations as well as human populations. Think about which distribution pattern best describes human populations.
There are three common methods used by population ecologists to determine the size of a population. As you explore the following interactive, think if each method could be used to accurately determine human population.
3Tabs
How does understanding change?
Understanding 25. How could different population distribution affect the accuracy and reliability of these three methods of determining population size?
Connect 2
Now, let’s start by connecting some important ideas and words about population ecology. Choose any two words from the table below then connect them with a complete idea.
|
random |
sedentary |
mark-recapture |
|
density |
counting |
clumped |
|
mobile |
quadrat |
uniform |
Determining population size and density is a useful first step in determining population dynamics. For example, when Ecologists study the effect of human ecological footprint on natural populations they start by looking at changes in population number for different species. Is there a way to see if our efforts to reduce our ecological footprint is working? The Living Planet Index is a UN-recognized measure of the trend in the population changes for over 3,600 different vertebrate species in all biogeographic regions around the world. You can see which species close to where you live are part of this important study of biodiversity loss using data from the Zoological Society of London and World Wildlife Foundation.
How do small steps lead to changes?
Changes 13. Choose at least three different species each from three different vertebrate classes. What pattern do you see in the Living Planet Index for those vertebrate classes? Is one vertebrate class being more or less affected by human activity?
Dynamic Populations
An important thing to remember in ecology is that ecosystems are constantly changing. When ecologists think about conserving natural populations they are thinking in terms of a range of population size rather than a specific size. Individuals within a species are constantly interacting with each other, intraspecifically, with members of other species, interspecifically, and with the abiotic environment. The effect of these interactions is changes in population growth. The rate of population growth, mathematically shown as r, is a value of the percent change in population, described as a decimal. Average growth rate can be simply calculated in the following way:
 Example
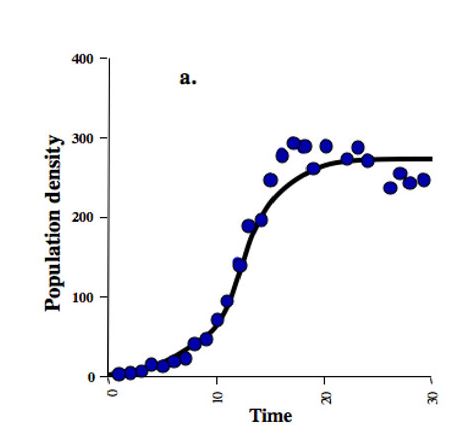
by Nature.com
Using your best judgement to read the graph, you can make the following calculation:
Max. population = 280 cells/cm3
Min. population = 5 cells/cm3
Starting time = 0 d
End of growth time = 21 d
Average Growth Rate = (280 - 5)/(21- 0) = 13 cells/cm3/d
Population Dynamics
As we saw earlier, in Unit 2, Activity 2 on enzymes, an interesting way to show cause-and-effect relationships is with a fishbone diagram. Complete the fishbone diagram to show how different factors cause an increase or decrease in population size.
At the end of this Activity you will be analysing different interactions between species using the details you collect here. Watch one of the following videos to learn more about the interactions. This will give you an overview of the factors important in population dynamics.
Be sure to leave room for more details to add as you work through this Activity.
Interactions can be broadly divided into two categories:
- Density-independent factors are typically abiotic factors that affect population size, either increasing or decreasing it. Examples include weather and climate, natural disasters and human interventions in natural habitats. As you explore this section, think if density-dependent and density-independent factors similarly affect human populations.
- Density-dependent factors, on the other hand, are typically biotic factors that can increase or decrease a population size. Because their effect on population growth increases with population size, these factors have the effect of feeding back on themselves.
For example, the Allee effect is a concern for small or spread out populations. Certain density-dependent factors can amplify their effects on populations. For the Allee effect, as the population gets smaller the ability for individuals to find mates in order to reproduce decreases leading to a further reduction in population size. We call this type of feedback positive feedback (definition:A cyclic response that can continue to amplify a stimulus.)even though the effect is to lower the population because the population size is moving away from a healthy population size. In this instance, the Allee effect can lead to species extinction.
Another density-dependent factor that contributes positive feedback is the number of reproducing individuals. As the population increases the ability for individuals to find mates in order to reproduce increases leading to a further increase in population. After a few generations, the population grows exponentially. Examples of this type of population growth include plants and animals reproducing in springtime, and bacterial infections.
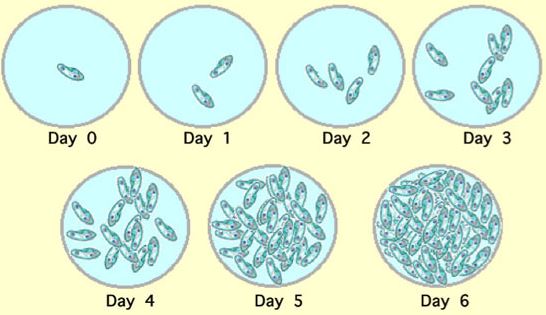
Under the right conditions, Paramecium caudatum can double in number every day. The population is sampled daily and viewed under a microscope.
by Nature.comOther density-dependent factors work in the opposite way: they help to bring population growth back towards a healthy size. This is described as negative feedback. In the example of feedback that we saw earlier, in Unit 2, Activity 5 on cellular respiration, an enzyme was inhibited by a buildup of products from a metabolic pathway. Feedback inhibition is an example of negative feedback. Many interspecific interactions are also examples of negative feedback. Some of these interactions are summarized in this video.
All these interactions involve a benefit to at least one of the species. For mutualism, both species benefit and allow for positive population growth, while for commensalism, the second species experiences no benefit or harm. The population does not change because of this interaction. Parasitism, however, harms the second species for the benefit of the first.
Three other important interactions involve harm to at least one population of individuals: predation, herbivory, and competition. Of these, competition poses the greatest threat to both populations as it ultimately harms both populations more than if they didn’t interact with each other. Since evolution is driven by survival of the fittest, natural selection favours individuals that can avoid and minimize the negative effects of these three biotic interactions.
Human activities affect natural populations, often in a negative way. Conservation efforts work to stop, or at least slow down, these negative effects. In essence, conservation is about saving the natural world as we know it. The ecologists that get involved in conservation do so for personal reasons, as we can see in this video.
As ecologists get to know a species often they uncover surprising behaviours. Elephants, for example, are more similar to humans than first impression. You can learn more about their human qualities in this persuasive article about recent conservation efforts in saving the African elephant.
If you want to view any links in this pdf, right click and select "Open Link in New Tab" to avoid leaving this page. (View the original article.)
How does understanding change?
Understanding 26. Choose a specific detail about animal behaviour described in the article to show how learning about elephant populations help governments make choices about their conservation.
 Canadian Contributions
Canadian Robert MacArthur was interested in how different species of similar birds were able to live in the same group of trees. In MacArthur’s time it was believed that competition among two populations should lead to the death of one at the exclusion of the other: no two competing populations could ever coexist forever. MacArthur set out to mathematically model where different species of warblers lived within the same tree.
MacArthur compared populations of warblers from one species with those of mixed populations. He found that on their own, each warbler was able to exploit the resources in the whole tree. However, in mixed populations he noticed that each species divided the part of the tree. By exploiting different parts of the tree, the warblers were able to minimize competition. This adaptation is known as resource partitioning.
How do small steps lead to changes?
Adaptations that avoid the negative effects of parasitism, predation, herbivory and competition fall into several general categories: behavioural adaptations, structural adaptations, chemical defences, and colour adaptations.
Find an example of two specific adaptations. Compare how they help to minimize the negative effect of biotic interactions. Your comparison should include both similarities and differences.
Density-dependent factors that are part of negative feedback on population help to keep a population from growing beyond its carrying capacity. When population growth is subject to a carrying capacity the population starts growing exponentially, but with time it starts to level off.
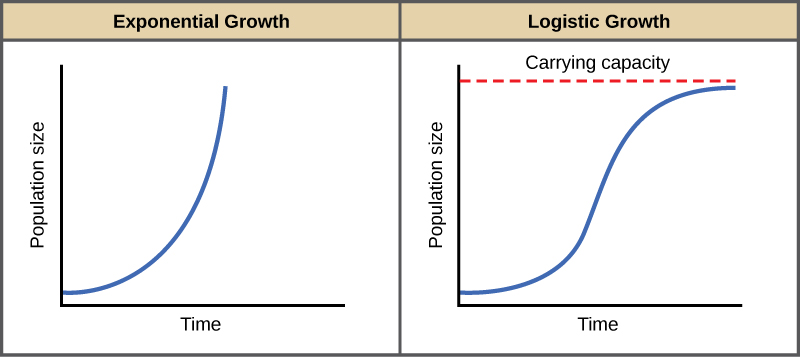
In other words, the population growth changes depending on how close or far it is from the carrying capacity. This type of growth is called logistic growth.
Simulation
Let’s see if we can find out under what conditions the growth rate is the greatest. Consider the following simulation of two populations each with a starting population (N) of 5 individuals and a carrying capacity (K) of 500. They have different maximum growth rates, r. Run the simulation from Virtual Biology Lab to see the change in population and population growth rate. See when the growth rate is greatest.
Be systematic as you test each of the three variables, N, K, and r. How does the maximum growth rate change with time as you manipulate the variables? Add these details to your fishbone diagram.
How do small steps lead to changes?
In 1965 the human annual global growth rate was was 2.1 %. By 2015 it had fallen to 1.2 %.
Changes 14. Use the results of your investigation and these changes in annual growth rate to determine if global population is near to or far from reaching a carrying capacity.
The graph shown here is an idealized version of population growth that makes it easier to mathematically describe changes. In real life, however, the population growth curve is never so smooth. Using data from the furs caught by the Hudson’s Bay Company, Ecologists were able to recreate the population of hare (prey) and lynx (predators).
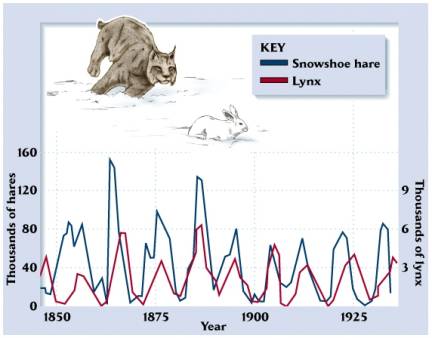
by The Glyptodon
Indeed, the population growth curve here looks quite different from either exponential or logistic growth. Mathematically, we could describe this as sinusoidal growth, but, defining the period, maxima and minima of populations is difficult because of the many biotic and abiotic interactions not shown on the graph.
How does energy move in food systems?
Energy 7. How does understanding the flow of energy in a food chain help you to identify the predator and prey in the graph of snowshoe hare and lynx populations?
Population Dynamics
In this Activity you have found details to describe the causes of population dynamics.
Check over your fishbone diagram of causes and effects on population size.
Your fishbone diagram should include these concepts and details:
- the methods of measuring and describing populations,
- density-dependent and density-independent factors,
- the types of biotic interactions and adaptations related to minimizing negative population growth.
Ask yourself these big questions as a way to monitor and improve your work:
- Is the information I have presented a complete representation of my learning?
- Is the information I have presented correct?
- Have I fulfilled the requirements of the task?
- Are the different causes of changes in population size clearly connected to their effects?
How does understanding change?
In this Activity we looked at some of the ways that natural populations can be described and measured. The amount of energy available to a population determines its growth rate. Likewise, different density-independent factors and density-dependent factors, like biotic interactions, affect population dynamics.
Understanding 27. Using these specific details from this Activity, assess if human populations follow the same rules as natural populations?
CONSOLIDATION
Summary
- some factors act through positive feedback leading to extinction or exponential growth;
- other factors act through negative feedback leading to logistic or sinusoidal growth;
- human population growth changes in response to technological and energy changes;
- the ecological footprint from human populations is measured through the Living Planet Index and Global Footprint Network.
 Investigating Biotic Interactions
You are now ready to complete the assessment for this Activity. Perform a virtual lab to investigate the effects of three populations interacting. As you prepare for, perform and report about your investigation, look for opportunities to practice good Organization skills. (definition:I can identify, gather and use resources to complete a task.) Look for ways to present data in a clear and organized fashion. As well, use vocabulary related to population dynamics to describe these biotic interactions.
Investigation: Biotic Interactions
Materials Needed:
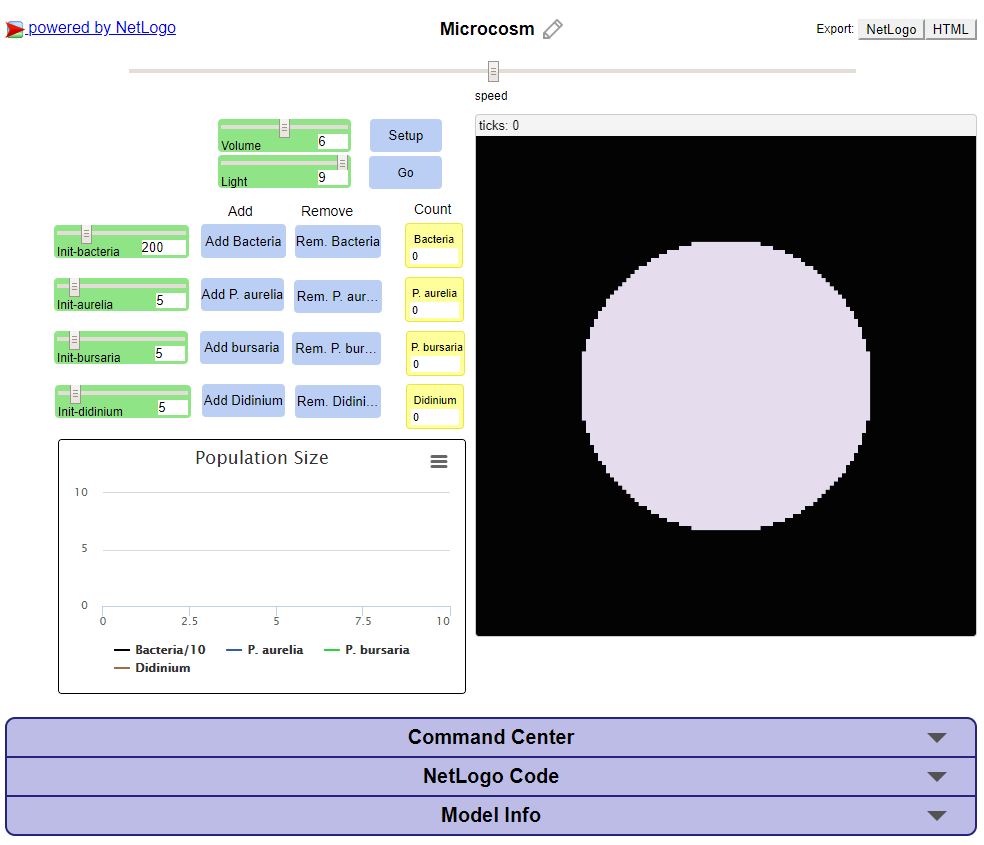
This Microcosm Model is used to simulate the population growth in Escherichia coli (bacteria), Paramecium aurelia (protists), Paramecium bursaria (protists) and Didinium nasutum (protists).
Procedure:
(modified with permission from Virtual Biology Lab)
The model opens to a virtual petri dish, which is initially filled with sterile nutrient broth. You can add a specified amount of each microbe, and watch them move about the dish. When ‘Go’ is clicked, the individuals reproduce, feed or die. The volume and light level of the microcosm can be adjusted in the simulation. Take some time to familiarize yourself with the model before beginning the exercise. Clicking on ‘Go’ a second time stops the simulation, and clicking on ‘Setup’ resets the simulation. You can download your graph using the buttons in the top right corner above the graph.
- Add the default amount of 200 bacteria into the petri dish. Select ‘Go’ to observe the population grow over time. Record observations about the time the population grows, the change in population size, and type of population growth. Calculate the average population growth.
- Repeat three more times, once for each protist species and each with an initial population of 20.
- Next, reset the simulation. Choose two of the three protist populations to study further. Add the bacteria with the first two of the populations you chose into the petri dish. Keep all other variables the same, including initial population numbers. Record observations about the time the population grows, the change in population size, and type of population growth. Calculate the average population growth.
- Repeat step 3 for the bacteria and second protist population you chose.
- Repeat step 3 for bacteria together with the two protist populations you chose.
Interpretation and Analysis:
Use quantitative and qualitative results to interpret and explain the different growth rates for each of the populations.
If you prefer, you can download a copy of this investigation.